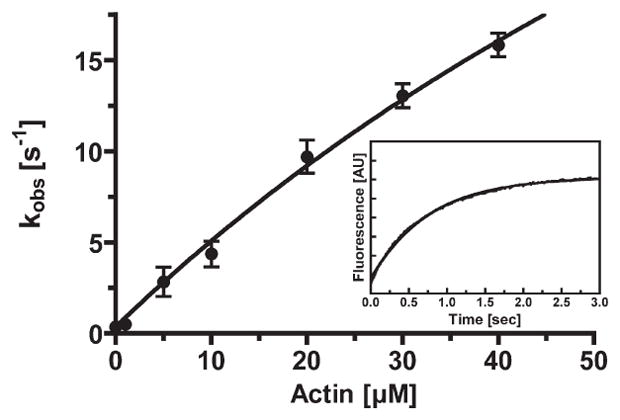
Figure 6.

Release of phosphate from acto-p-huM3AMD. The rate of release of phosphate from huM3AMD was measured by using MDCC-PBP. p-huM3AMD (1.5 μM) was mixed with 60 μM MgATP, aged for 5 s, and then mixed with 3 μM phosphate binding protein in the presence and absence of actin. The actin concentration dependence of the rate of phosphate release is shown. The apparent rate was increased with actin concentration to yield the maximum rate of phosphate release of 70 ± 24 s−1 and a Kactin of 138 ± 58 μM. The error bars represent the standard error from three to six independent experiments. The inset shows a typical recording of the MDCC-PBP fluorescence change at 5 μM F-actin. Time course fits to double-exponential kinetics with a fast kobs of 2.0 s−1.
