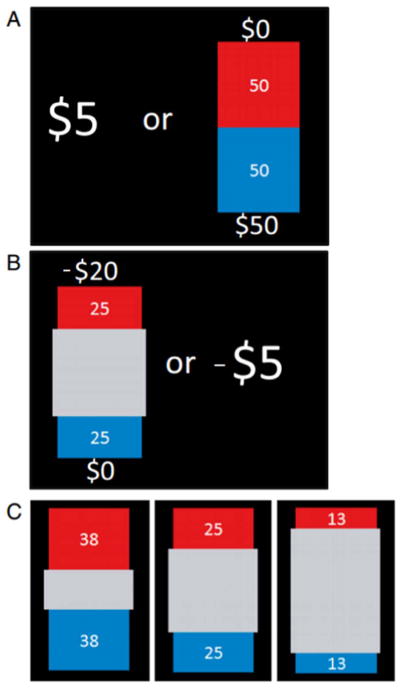
Fig. 1. Experimental design.
On each trial, participants chose between $5 during gain blocks or −$5 during loss blocks and a lottery. Lotteries varied in the amount they offered and in either the winning probability or the level of ambiguity around that probability. The lottery appeared on the screen as a bag containing a total of 100 red and blue plastic chips. The red and blue areas of the bag represented the relative numbers of red and blue chips. The numbers next to these areas represented the sums of money that could be won if a chip of that color were drawn ($5, $8, $20, $50, or $125, −$5, −$8, −$20, −$50, or −$125, depending on the block and the trial; SM, S.5). A: In risky trials, the lottery payoff and outcome probability were precisely specified. The number of chips associated with a winning color was 13, 25, 38, 50, or 75, depending on the trial (SM, S.5). B: In ambiguous trials, part of the bag was hidden by a gray occluder. Thus the number of chips associated with a winning color was uncertain, C: 3 levels of uncertainty were used. The number of chips associated with a winning color belonged to a small (between 38 and 62), medium (between 25 and 75), or wide (between 13 and 87) range, always centered around 0.5 probability (SM, S.5).

