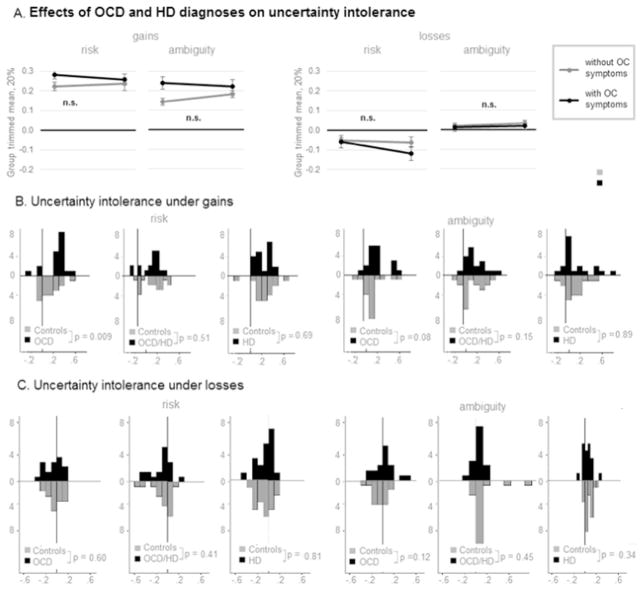
Fig. 5. Uncertainty aversion in individuals with OCD and/or HD and controls.
Effect of diagnosis (OCD and/or HD vs. Controls) on risk and ambiguity attitudes during gain blocks and loss blocks. Bars: histograms of respective distributions. Curves: empirically approximated normal curves. Since proportion of inconsistent choices under losses was not normally distribute, instead of group mean the corresponding figure presents the group trimmed mean at 20% - a statistical measure of central tendency that involves the calculation of the mean after discarding 10% of a sample at both the high and low end.

