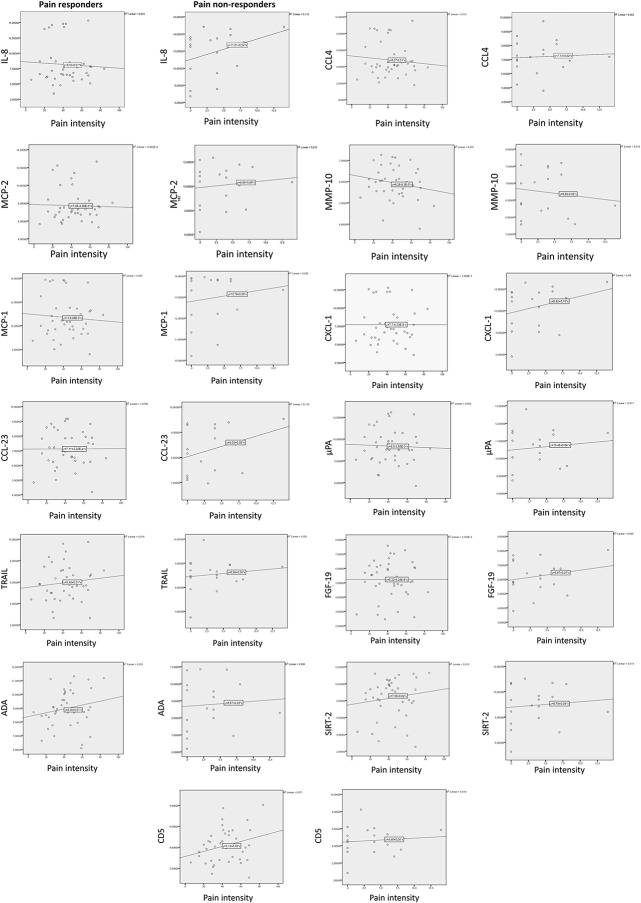
Figure 3.
Scatterplots with linear regression line of pain intensity (VAS) and the 13 biomarkers with NPX difference >0.5 in pain responders and pain nonresponders. ADA, adenosine deaminase; NPX, normalized protein expression; TNF, tumor necrosis factor; TRAIL, TNF-related apoptosis–inducing ligand; VAS, visual analogue scale.

