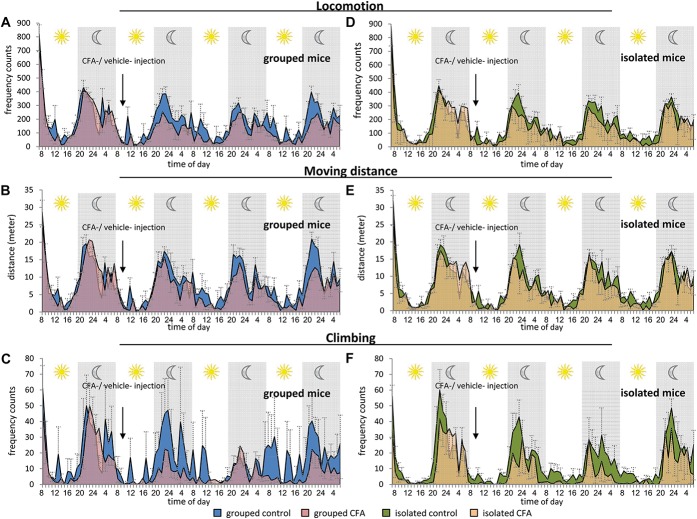
Figure 6.
Time profile of homecage behavior of mice following unilateral CFA inflammation. Animals were analyzed continuously for 24-hour basal measurement and up to 3 days following 20 μL CFA or vehicle unilateral hind paw injection. All left column panels (A-C) show results from CFA and control animals which were previously housed in groups, and all right column panels (D-F) show results from CFA and control animals which were housed individually. Blue background curves represent data from control animals, and red curves represent behavioral data from CFA animals. (A, D) Locomotion frequency, (B, E) total moving distance (in meters), and (C, F) climbing frequency counts. N = 7 control-grouped mice, 8 CFA-grouped mice, and 6 mice per group for isolated animals. All data points represent mean ± SEM.

