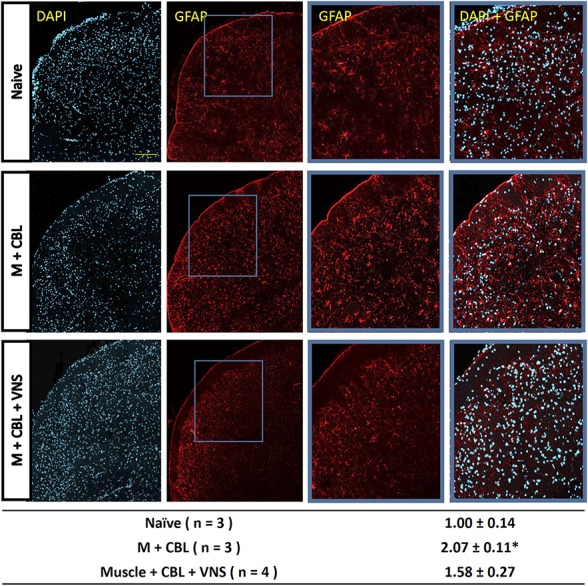
Figure 5.

Vagus nerve stimulation (VNS) inhibits GFAP expression in astrocytes. Representative ×200 images taken in laminas I to III of the medullary horn in the upper spinal cord depicting DAPI and GFAP staining in naive, M+CBL, and M+CBL+VNS samples taken 3 hours after California Bay leaf (CBL) exposure. Scale bar = 100 μm. Blue boxes placed in GFAP images indicate areas that were selected for enlarged images in the third and fourth columns. The table below the images summarizes the average fold change ± SEM as compared to levels detected in naive samples, which the mean value was set equal to 1. * denotes significance from naive levels where P < 0.05.
