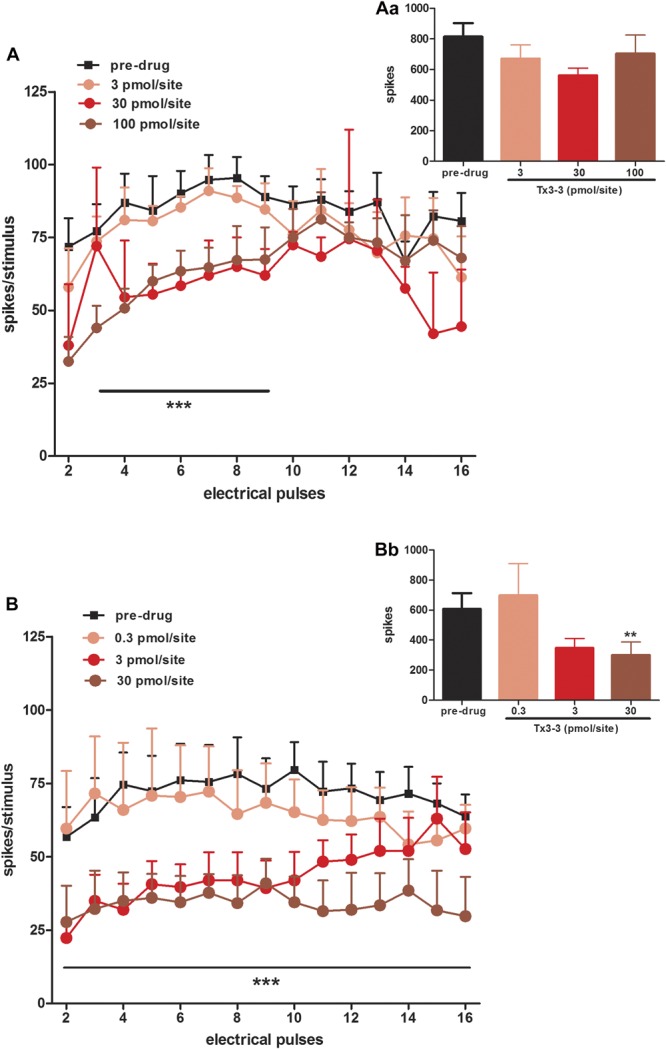
Figure 2.

Effect of spinally applied Tx3-3 on the electrically evoked neuronal wind-up and input responses recorded from naive (A, Aa) and spinal nerve ligation (B, Bb) rats. Data are expressed as mean number of spikes evoked per stimulus of the electrical train of 16 stimuli (wind-up; A, B) and mean number of spikes evoked by the first stimulus of the electrical train × 16 (input; Aa, Bb) ± SEM. Each point or column represents the mean response of 5 to 7 neurones. Vertical lines show the SEM. Statistical analysis was determined using 2-way analysis of variance for wind-up response (A, B) and paired t test for input response (Aa, Bb). Asterisks denote the significance levels in comparison to predrug values, **P < 0.01, ***P < 0.001.
