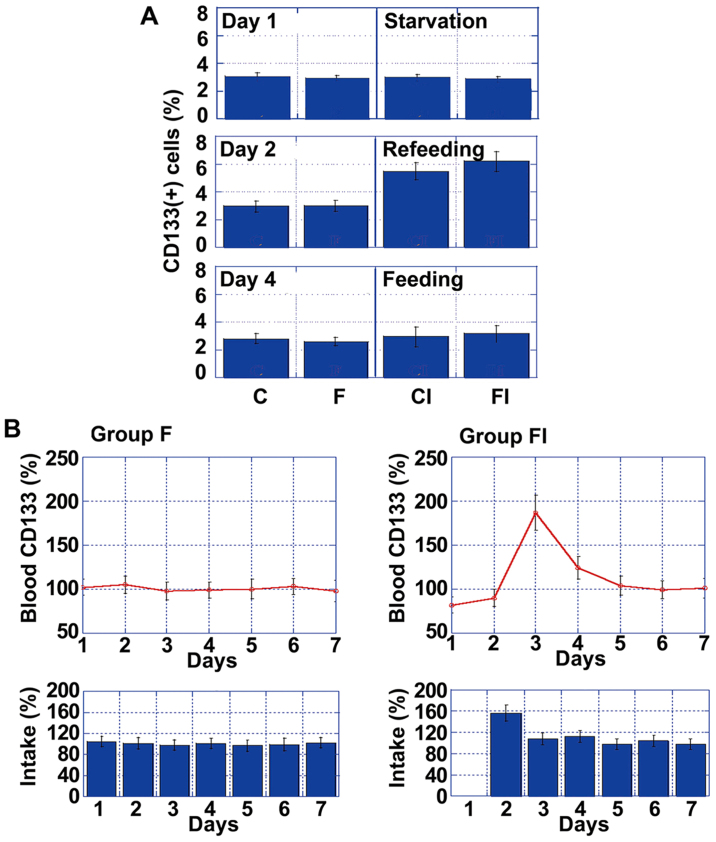
Figure 2.
Temporal changes in CD133 expression. (A) Percentage of CD133+ cells on day 1 (fasting), day 2 (re-feeding) and day 4 (feeding). (B) Time-course analysis of CD133 mRNA levels in the blood and food intake in groups F (high-fat diet) and FI (high-fat diet with ICR). mRNA levels and food calorie intake were standardized to those on day 1 for group F, which were set as 100%. Error bars indicate the means ± standard deviations. Group C, controls not subjected to intermittent calorie restriction (ICR); group CI, controls subjected to ICR.

