
Fig. 1. Spectra of water molecules in the d-glucose solution.
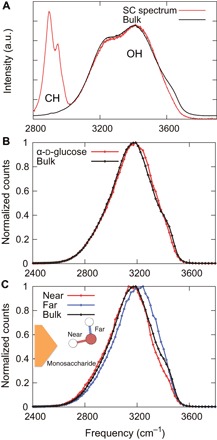
(A) Experimental Raman spectrum of the bulk (black line) and SC spectrum (red line). The SC spectrum was obtained using the spectra of d-glucose solutions in 0, 0.05, 0.1, 0.3, and 0.5 M. (B and C) The OH vibrational spectra of water molecules obtained by the Car-Parrinello MD (CPMD) simulations using the wavelet analysis within 3.5 Å of α-d-glucose (red line) (B) and near (red line) and far (blue line) OH bonds (C). The “near” and “far” represent the OH bonds from the monosaccharide oxygen atoms. a.u., arbitrary unit.