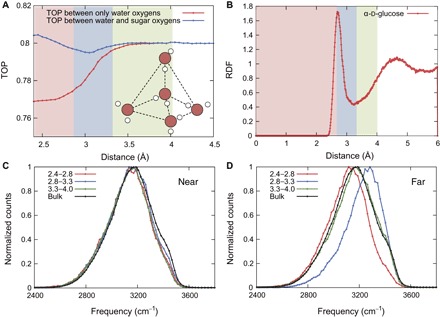
Fig. 2. Relationship between water arrangement and vibration in the α-d-glucose solution.

(A) Average TOPs as a function of the distance between the oxygen atoms of monosaccharide and water molecules. Red and blue lines show the calculation without and with monosaccharide oxygen atoms, respectively. (B) RDF as a function of the distance between the oxygen atoms of monosaccharide and water molecules. (C and D) Near and far OH vibrational spectra of water molecules separated by the characteristic regions in the TOP between water and sugar oxygen atoms. Colored lines are the spectra using water molecules located between 2.4 and 2.8 Å (red), 2.8 and 3.3 Å (blue), and 3.3 and 4.0 Å (green).
