
Fig. 3. Multiscale analysis of n = 3 MA CQWs in solution and lamellar solid.
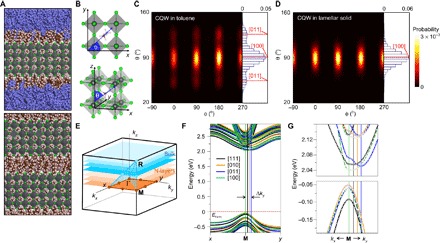
(A) Computer-generated molecular models (brown, carbon; light pink, hydrogen; green, bromine; light blue, nitrogen; gray, lead; violet, carbon in toluene) of individual CQW in toluene (top) and in aggregated CQWs (lamellar solid; bottom) with n = 3 MA compound. (B) Three-dimensional schematics of the orientation of each organic cation (blue arrow corresponding to the N-C axis) defined by a spherical coordinate system with polar axis along the z direction, as well as in-plane azimuthal (φ) and polar (θ) angles. Orientational distribution contour maps (φ, θ) of surface MA cations in (C) toluene solution and (D) lamellar solid. (E) Brillouin zone of bulk (faint blue) and N-layer (faint orange) perovskite QW lattice in an orthorhombic cell. Symmetry points at boundaries of the zone where the bandgap is direct change from R (in bulk) to M (in N-layers). kz is oriented perpendicular to the QW surface. (F) Calculated band structures of n = 3 MA QWs with different orientations of surface MA cations, along [111], [010], [011], and [100] directions. The most indirect bandgap is observed for the [011] with a wave vector difference Δky relative to the M point. The most direct bandgap is observed for the [100] with no relative displacement along ky. (G) Magnification of the bands around the M point for small kx and ky, highlighting the change in the band edges for the different MA configurations. Top and bottom panels show the conduction and valence bands, respectively, highlighted with filled points. Labels follow those in (F).