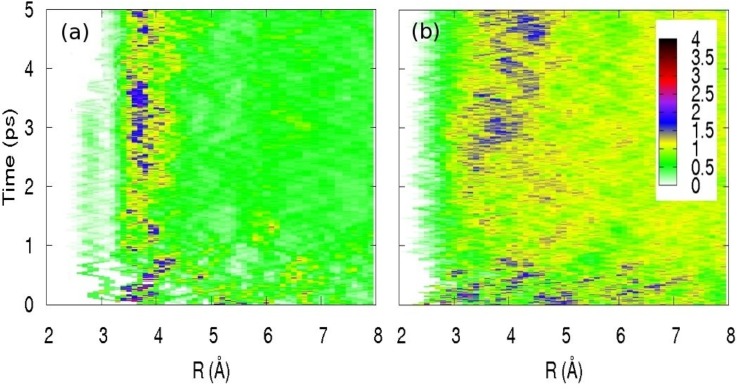
FIG. 6.
(a) Time evolution of the I0–O radial distribution for the first 5 ps following the removal of an electron from iodide. These distributions are obtained from an average over 15 starting configurations over the entire time range; (b) same for I0–H. Reproduced with permission from Pham et al., J. Am. Chem. Soc. 133, 12740–12748 (2011). Copyright 2011 American Chemical Society.

