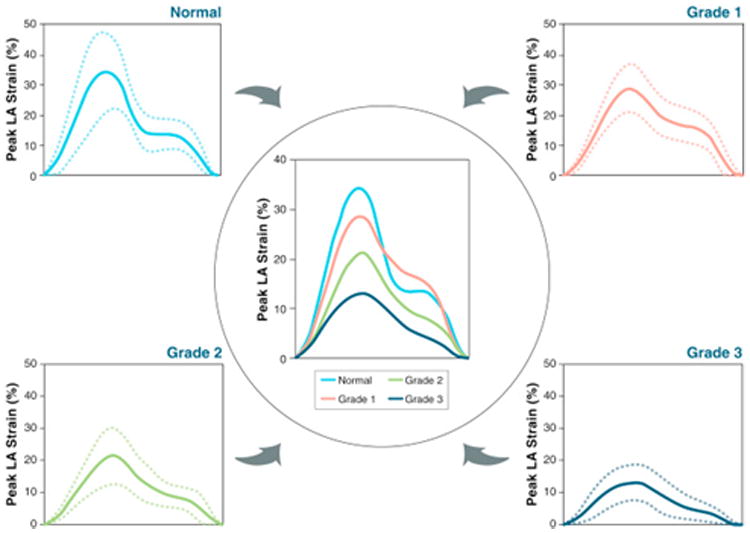
Figure 3. Composite LA Strain Curves for Individual DD Grades.

At the 4 corners, composite LA strain curves are depicted as mean of each subgroup (solid lines) with standard deviation (dotted lines). Center panel shows all 4 LA strain curves in a single plot to facilitate comparisons. Abbreviations as in Figures 1 and 2.
