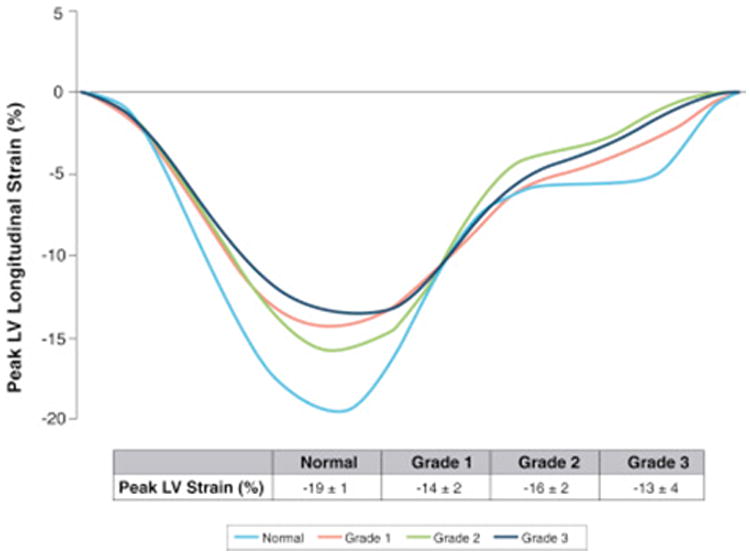
Figure 4. Composite LV Strain Curves for Individual DD Grades.

Subset of patients with longitudinal left ventricular (LV) strain curves shown by diastolic dysfunction (DD) grade, demonstrating that with grade 3 DD dysfunction there is a significant decrease in peak longitudinal strain of the LV, despite preserved ejection fraction. However, there is overlap of LV strain curves observed between grades 1 and 2 DD.
