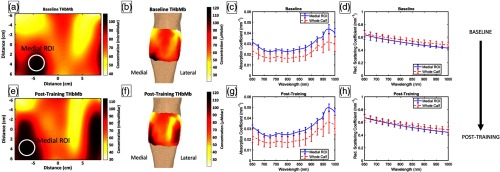
Fig. 2.
This figure shows sample THbMb DOSI images, THbMb surface renderings, and optical properties for a participant’s right leg. (a) Baseline DOSI THbMb map with the approximate medial RoI marked. (b) Baseline DOSI THbMb surface rendering. (c) Mean ( dev) absorption coefficients across the medial RoI and across the entire calf. (d) Mean ( dev) reduced scattering coefficients across the medial RoI and across the entire calf. (e–h) The corresponding figures 5-week post-training. Color bars show concentration of THbMb in . THbMb, total-hemo+myoglobin; DOSI, diffuse optical spectroscopic imaging.

