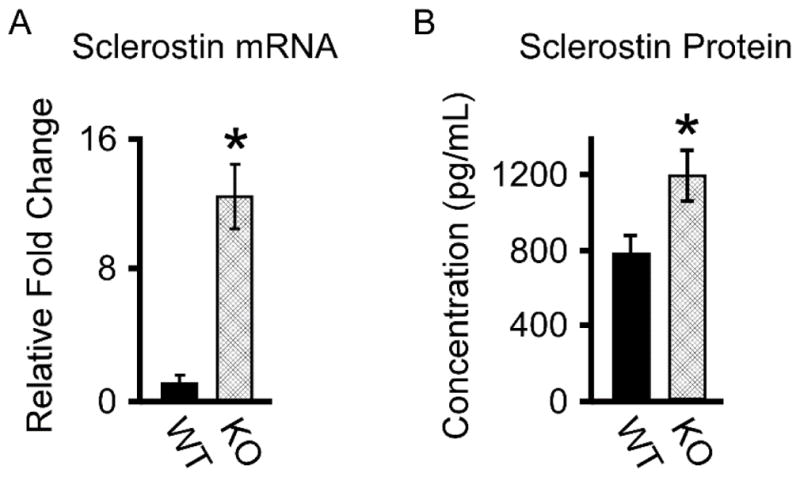
Figure 1.

Sclerostin mRNA and protein levels in WT and TIEG KO mice. A). RT-PCR analysis of sclerostin mRNA levels in whole femurs devoid of marrow isolated from WT and TIEG KO mice. B). ELISA analysis of sclerostin protein levels in the serum of WT and TIEG KO mice. * Denotes significance at the P<0.05 level between WT and KO mice.
