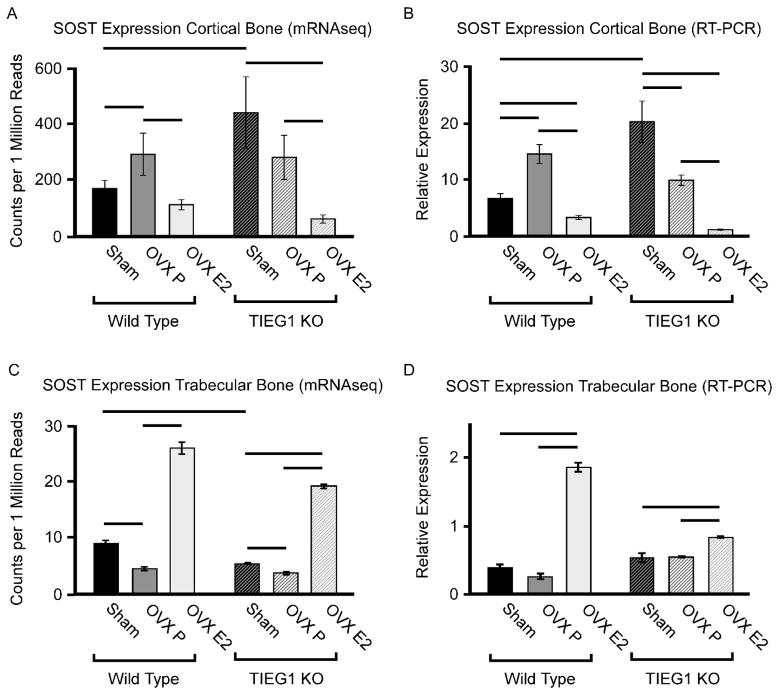
Figure 5.
SOST expression levels in cortical vs. trabecular bone compartments of femurs isolated from WT and TIEG KO mice following sham, ovariectomy (OVX) and OVX + estrogen replacement therapy (OVX E2). Sclerostin mRNA levels in cortical bone as detected by mRNAseq (A) and RT-PCR confirmation (B) in indicated mouse groups. Sclerostin mRNA levels in trabecular bone as detected by mRNAseq (C) and RT-PCR confirmation (D) in indicated mouse groups. Bars denote significance at the P<0.05 level between indicated mouse groups.

