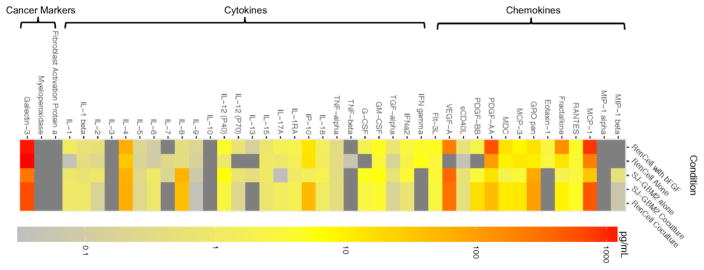
Figure 1.
Heat map representing cytokine and chemokine amounts released by ReNcells alone (presence or absence of bFGF), SJ-GBM2 cells alone, ReNcell cocultures, and SJ-GBM2 cocultures, as measured via laser bead immunoassay. Each row corresponds to one culture condition, and each column corresponds to one analyte. Analytes were clustered based on their type – cytokines, chemokines and cancer markers. Cocultures were performed using a Transwell® setup. The actual analyte concentration levels were shown in Supplementary Figure 4. No detectable levels of IL-10, IL-3, MIP1α, Myeloperoxidase, and Fibroblast Activation Protein were found.

