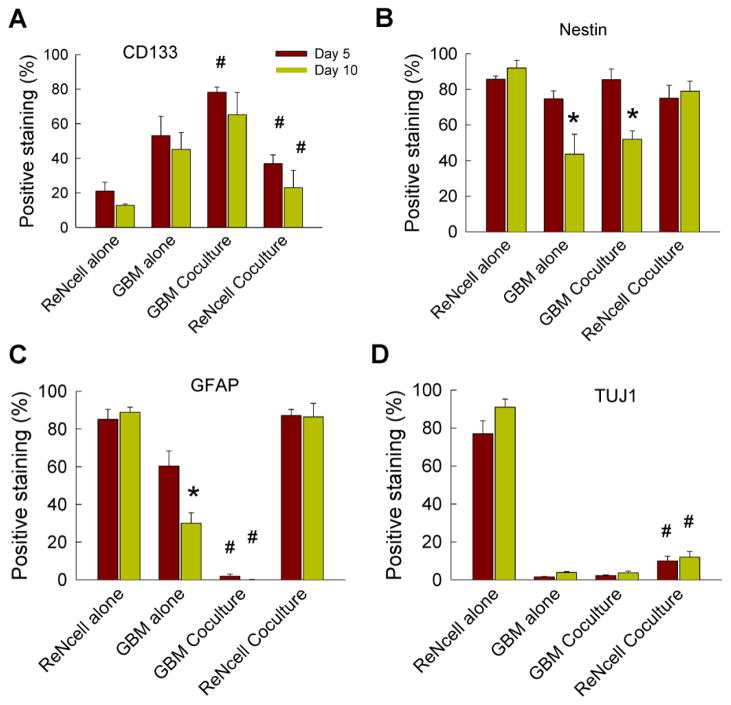
Figure 4.
Quantification of ReNcell and GBM phenotype in standalone and cocultures on days 5 and 10, staining for (A) CD-133, (B) Nestin, (C) GFAP and (D) TUJ1. Values are expressed as a percentage of the number of cells stained positively for the respective marker (normalized to total number cells staining positive for DAPI). * indicates significant differences (p < 0.05) between day 5 vs. day 10, while # indicates significance in differences (p < 0.05) between standalone and cocultures of ReNcells or GBMs, at a given time point. Error bars represent mean ± SEM for all cases (n = 3/case).

