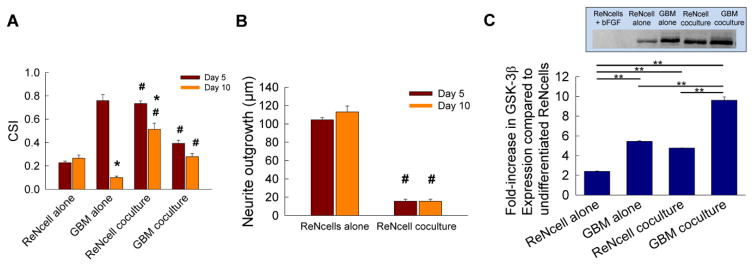
Figure 5.
(A) Cell shape index (CSI) was measured using a particle analyzer plugin in ImageJ software, from images captured on days 5 and 10. CSI equal to one indicates infinitely elongated cell shape and a value of zero indicates perfectly rounded shape. (B) Average neurite outgrowth (μm) on days 5 and 10 was measured from TUJ1-stained cells within ReNcell cultures, in both standalone and coculture conditions. A NeuronJ plugin in ImageJ software was used to measure average outgrowth. * indicates significant differences (p < 0.05) between day 5 vs. day 10, while # indicates significant differences (p < 0.05) between coculture vs. standalone cultures at a given time point. Error bars represent mean ± SEM for all cases (n = 3/case). (C) Semi-quantitative western blot analysis of GSK-3β protein expression in ReNcells and GBM cells, cultured alone or in cocultures, at the end of 10 day culture period. Undifferentiated ReNcells (i.e., the presence of bFGF) were used as controls. Multi-fold increases in GSK-3β expression were noted in all the cases, with significantly higher levels in cocultures, specifically within GBM cells. Inset shows representative protein bands under respective culture conditions. ** indicates p < 0.05 vs. controls.

