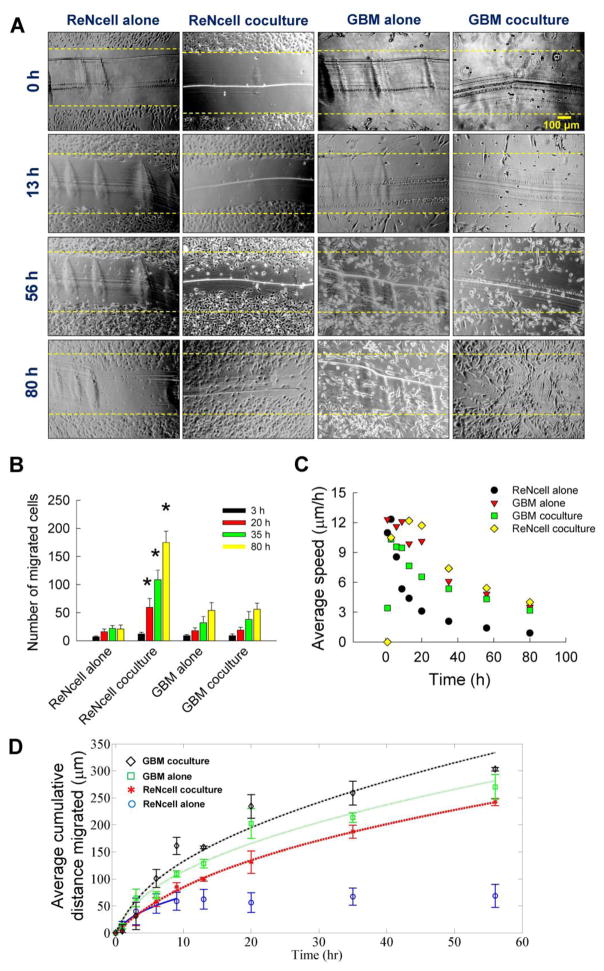
Figure 6.
(A) Representative bright-field images at selected time points, obtained from a scratch test assay. ReNcells or GBMs were cultured in 24-well plates, either standalone or in coculture (Transwell® setup) with the other cell type. Images were taken at regular intervals over an 80 h period to visualize cell migration. Yellow dotted lines in each image represent the starting position of the cells (at t = 0) when the scratch was initially made. Scale bar is 100 μm. (B) The number of ReNcells or GBMs, in standalone or cocultures, which migrated from their initial starting point into the cell-free zone created by scratch were quantified at various time points. * indicates significant differences in coculture vs. standalone cultures. Error bars represent mean ± SEM for all cases (n = 3/case). (C) The average cell speed (μm/h) was quantified in these cultures at various time points (n = 3 wells/time point). (D) The average cumulative distance (μm) covered by the cells was quantified at various time points (n = 3 wells/time point). Lines indicate the Ornstein-Uhlenbeck process model fit to the data shown in symbols. Error bars represent mean ± SEM for all cases.

