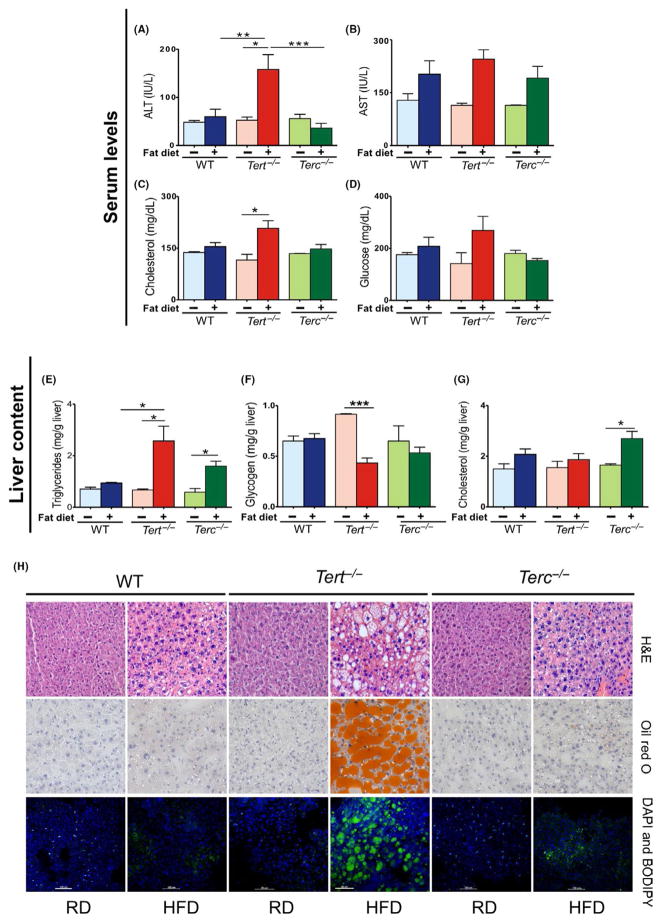
FIGURE 1.
Effects of 15-d HFD in Tert−/−, Terc−/− and WT male mice. Murine serum levels were quantified under RD and HFD conditions: (A) ALT (IU/L), (B) AST(IU/L), (C) cholesterol (mg/dL), (D) glucose (mg/dL) and murine liver content (mg/g of liver) were quantified under RD and HFD conditions: (E) triglycerides, (F) glycogen and (G) cholesterol. (H) Representative microscopy images of WT, Tert−/− and Terc−/− mouse liver sections: H&E or oil red O staining (light microscopy); and DAPI and BODIPY staining (confocal microscopy). Error bars indicate mean ±SEM. *P < .05 for the samples compared with RD conditions by Student’s one-tailed t test. Data represent WT (RD, n = 2; HFD, n = 7), Tert−/− (RD, n = 3; HFD, n = 4) and Terc−/− (RD, n = 2; HFD, n = 6) from two independent experiments. **P = .0026; ***P < .001

