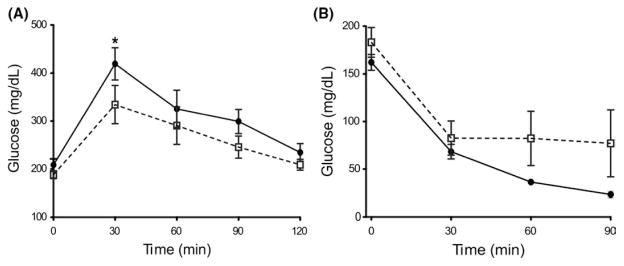
FIGURE 2.
Glucose clearance in Tert−/− and WT mice. (A) Blood glucose measurement at time 0–120 min after 50% Dextrose ip injection. (−) or (−) corresponds to Tert−/− (n = 8) or WT (n = 9) mice respectively (also applies to panels b). *P < .05 at time point 30 min. (B) Blood glucose measurement at time 0–90 min after insulin (Humulin) injection (ip). No influence detected in glucose clearance in Tert−/− (n = 4) or WT (n = 7) mice. Error bars indicate mean ±SEM. *P < .05 for the samples compared with WT conditions by Student’s one-tailed t test

