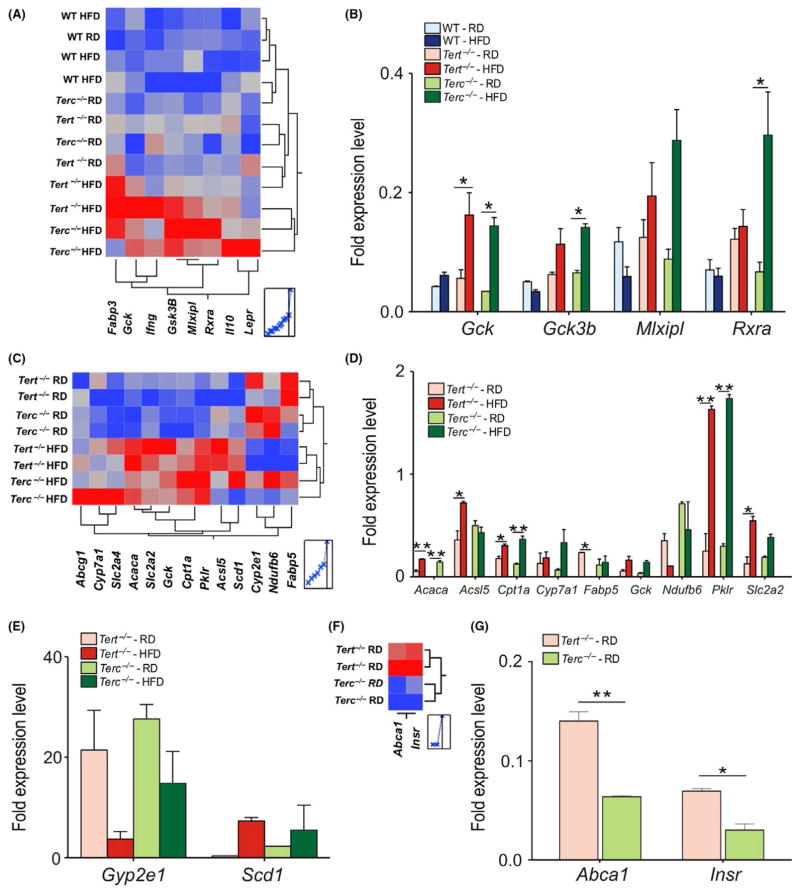
FIGURE 4.
Gene expression profiles in the liver of 6-month- old male mice fed RD and HFD for 15 d. (A) Heat map of hepatic expression of fatty liver genes affected by HFD exposure. Relative levels of gene expression are colour coded: the red or the blue colour represents the highest or lowest level of expression respectively. (B) Fold expression levels of affected genes under HFD conditions in WT, Tert−/− and Terc−/− mouse livers. Results were normalized to WT samples. (C) Heat map of hepatic expression of fatty liver genes from Tert−/− and Terc−/− mouse livers under RD and HFD conditions. (D–E) Fold expression of affected genes. (F) Heat map of Tert−/− and Terc−/− mouse livers under RD conditions. (G) Fold expression of Abca1 and Insr genes. Error bars represent SD. Statistical significance was determined by One-way ANOVA *P < .05; **P < .002. Data represent two mice/group from two independent experiments

