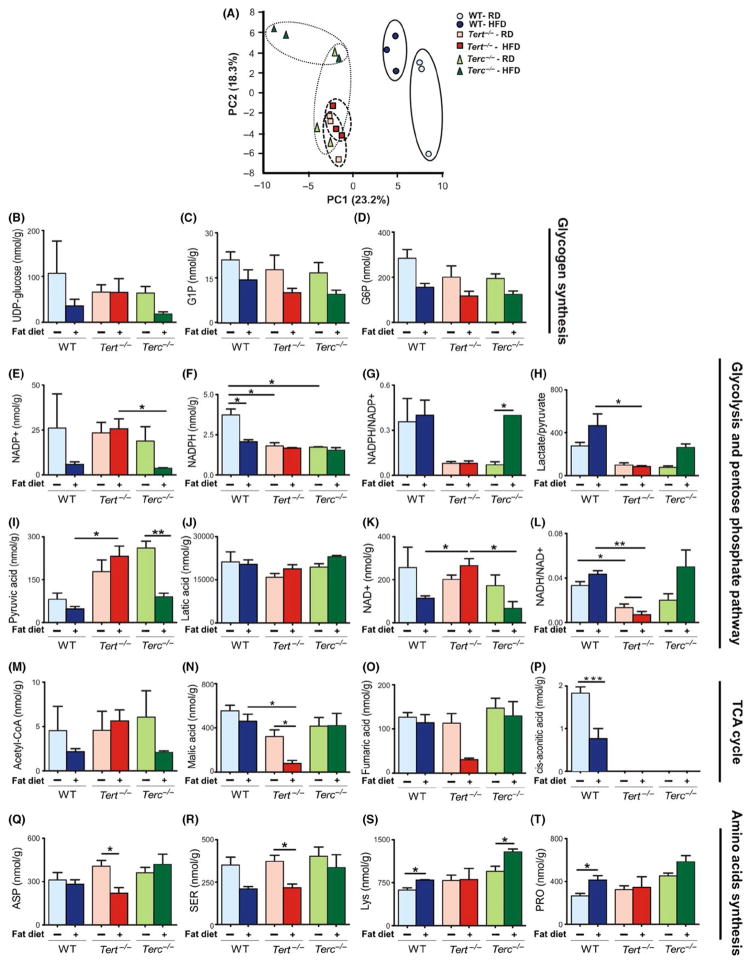
FIGURE 5.
Metabolic analysis in WT, Tert−/− and Terc−/− mouse livers. (A) PCA score plot showing the two first principal components for NMR spectra obtained on chloroform extracts of liver samples from mice under RD and HFD conditions. (B–D) Compounds related to glycogen synthesis. (E–L) Detection of compounds related to glycolysis and pentose phosphate pathway, and (M–P) compounds affecting the TCA cycle under HFD. (Q–T) Amino acid levels in WT, Tert−/− and Terc−/− mouse livers after HFD condition. Error bars represent SD. Statistical significance was determined by one-way ANOVA *P < .05; **P < .001; ***P < .0001. Data represent three mice/group

