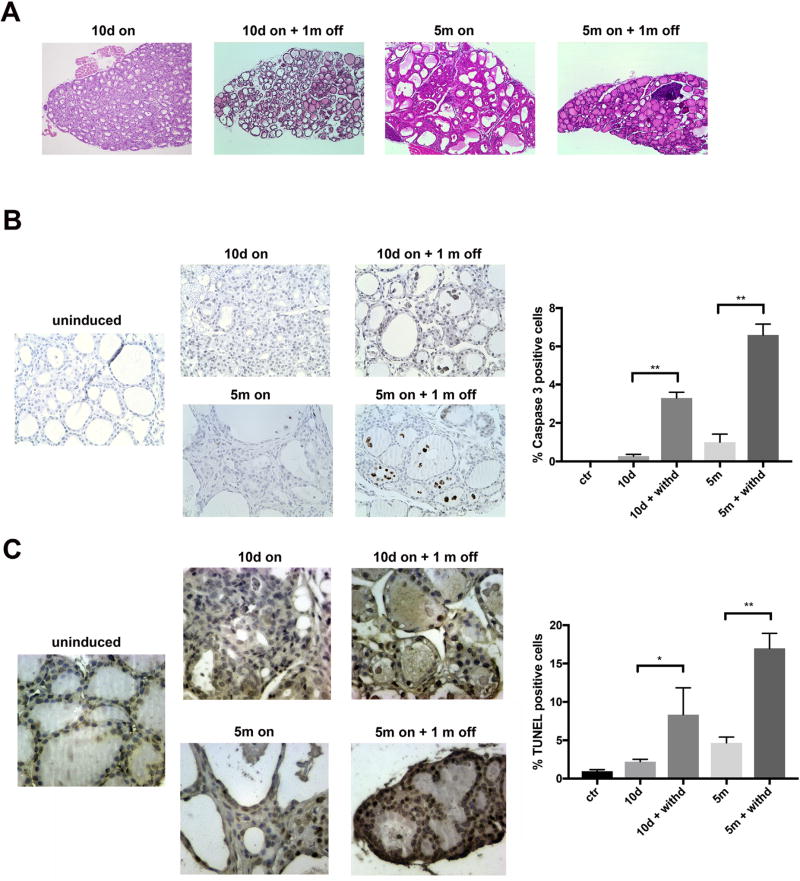
Fig. 4. RET/PTC3 withdrawal leads to apoptotic regression of thyroid lesions.
A) H&E staining of thyroids from Tg-rtTA/tetO-RET/PTC3 mice fed with dox chow for 10 days (10d on) or 5 months (5m on) and then regular chow (off) for 1 month (magnification 20x). B) Left: representative FFPE sections of thyroids from 10 days (10d on) or 5 months (5m on) dox-fed mice, then fed with regular chow (off) for 1 month, stained for cleaved caspase-3. Normally fed Tg-rtTA/tetO-RET/PTC3 mice were used as controls (uninduced) (magnification 40x). Right: bar graphs showing percentage of cleaved caspase-3 positive cells at the indicated time points. Data represent mean ± SD of counting of at least 400 cells from groups of 4–5 independent thyroids. The Mann-Whitney U test was used to determine statistical significance (**p < 0.01). C) Left: representative TUNEL assay stainings performed on FFPE thyroid sections from 10 days (10d on) or 5 months (5m on) dox-fed mice, then fed with regular chow (off) for 1 month. Normally fed Tg-rtTA/tetO-RET/PTC3 mice were used as controls (uninduced) (magnification 40x). Right: bar graphs showing percentage of cleaved caspase-3 positive cells at the indicated time points. Data represent mean ± SD of counting of at least 400 cells from groups of 4–5 independent thyroids. The Mann-Whitney U test was used to determine statistical significance (*<0.05; **p < 0.01).

