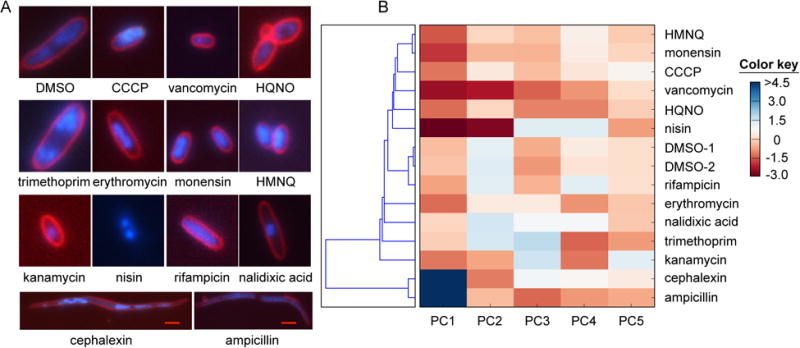
Figure 2.

Modes of action of HMNQ and HQNO determined by bacterial cytological profiling. (A) Typical cell cytology of E. coli visualized with three fluorophores 2 h after treatment with the indicated drug. The chosen antibiotics represent a number of known modes of antibiotic action. Note that HMNQ- and HQNO-treated cells reveal different cytological profiles. White scale bar, 2 m; red scale bar, 4 m. (B) Principal component analysis of the features in panel (A) clusters the antibiotics by mode of action. The relative contribution of each principal component is indicated by the color key. HMNQ clusters most closely with monensin and CCCP.
