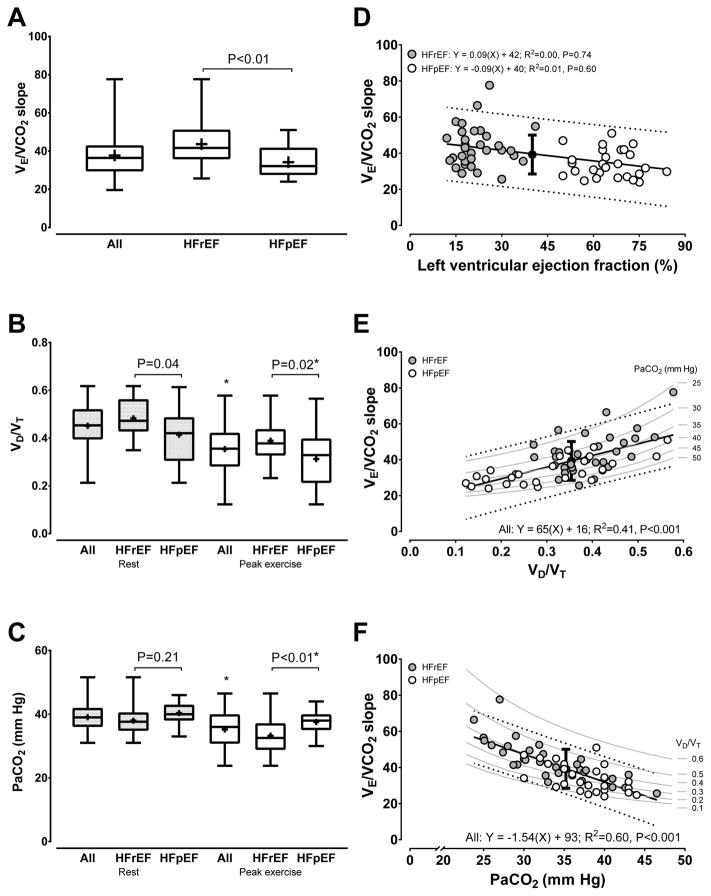
Figure 1.
Measurements or univariate linear regressions involving the ventilatory equivalent for carbon dioxide (V̇E/V̇CO2) slope, physiologic dead space to tidal volume ratio (VD/VT), or arterial carbon dioxide tension (PaCO2). Data presented in panels A to C are interquartile range with mean represented as (+). Variables presented on the abscissa in panels D to F are at rest, peak exercise, and peak exercise, respectively. For panels D to F representative of all participants: filled circle is mean ± SD of V̇E/V̇CO2 slope at the mean of the variable set on the abscissa, solid line is goodness of fit line of the model fit equation, dotted lines are 95% prediction bands of the model fit equation, and grey bands are isopleths representing linked changes in observed V̇E/V̇CO2 slope and PaCO2 or VD/VT when either PaCO2 or VD/VT are theoretically constrained values. Interpretation of R2: modest=0.02; moderate=0.15; or strong≥0.25. The Y-intercept in panels D to F differed from 0.0 (P<0.01). Differences in R2: panel D vs. E or F, P<0.001; panel E vs. F, P=0.16. Heart failure with reduced (HFrEF, N=32) or preserved (HFpEF, N=27) ejection fraction. *Following post-hoc Tukey-Kramer testing, different within group for both HFrEF and HFpEF or all HF, rest to peak exercise, P<0.05.

