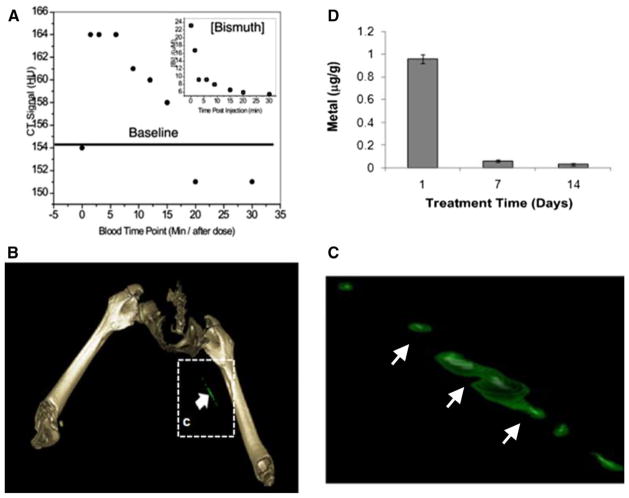
Figure 3.
(A) CT blood pool signal in rabbits following IV injection of NanoK. CT scan imaging parameters were thickness 0.8, increment 0.8, kV 90, mAs 1500, resolution HIGH, collimation 4 × 0.75, pitch 0.35, rotation time 1.5 seconds, FOV 75 mm. Inset The concentration of bismuth (ICP) in blood vs time post-injection. Note that the background signal is at baseline in less than 30 minutes; (B, C) targeting in situ clot (thrombus) in rabbits; (D) 2 weeks clearance profile of bismuth from mice. Reproduced with permission.119

