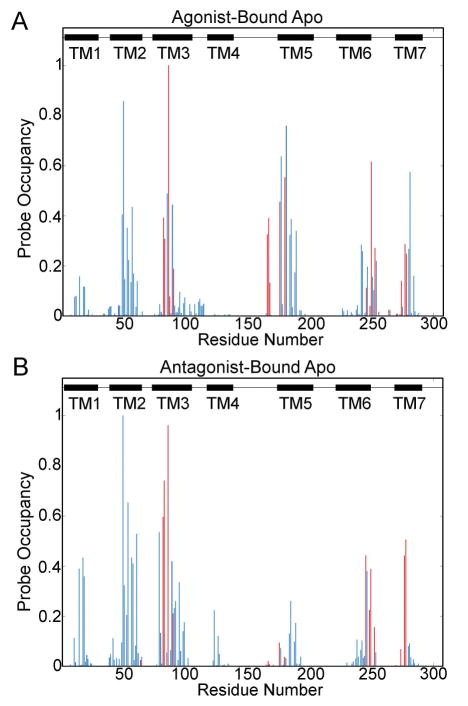
Figure 1. Probe Occupancy Per Residue during the Molecular Dynamic Simulations.
Probe occupancies for the agonist-bound apo simulation [A], and the antagonist-bound apo simulation [B] are shown. Binding site residues are shown in red, non-orthosteric residues are shown in blue, and black boxes represent the transmembrane regions. ICL1 is located in between TM1 and TM2. ECL1 is located between TM2 and TM3. ICL2 is located between TM3 and TM4. ECL2 is located between TM4 and TM5. ICL3 is located between TM5 and TM6, and ECL3 is located between TM6 and TM7.

