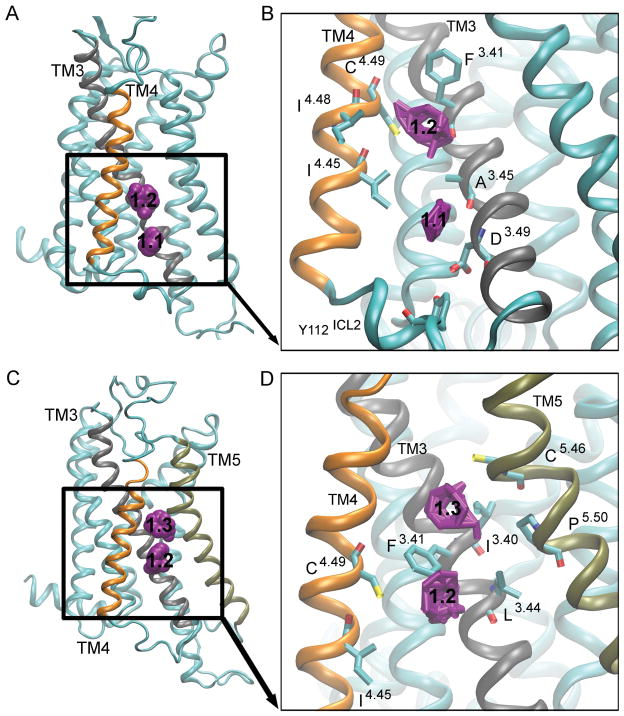
Figure 3. Hot spot 1: ‘The Intracellular Crevice’.
is located in the intracellular region between TM3 (gray), TM4 (orange) and TM5 (tan). The probes in the active [A] and the intermediate 1 conformers [C] are shown as purple spheres, with the numbers ‘1.1’, ‘1.2’ and ‘1.3’ denoting different regions of the pocket. The key interacting residues for the active clusters [B] and intermediate 1 conformers [D] are shown as bonds, and the probes that bind to this site are shown as purple bonds.

