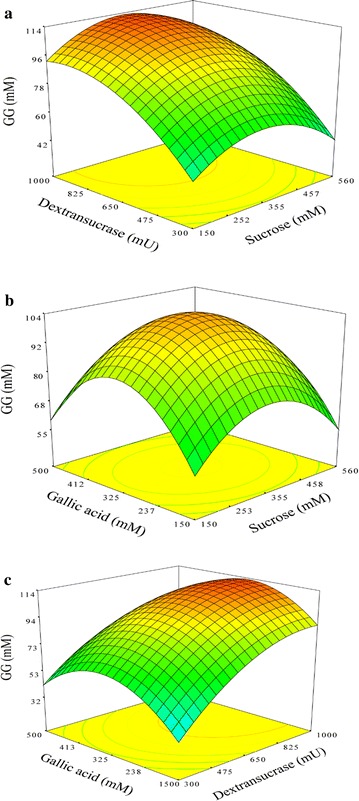
Fig. 2.

The response surface and contour plots of gallic acid glycoside (GG) production. The mutual interactions are shown between dextransucrase and sucrose (a), gallic acid and sucrose (b), and gallic acid and dextransucrase (c). The synthesis of gallic acid glycoside was optimized by dextransucrase from L. mesenteroides (61–1238 mU/mL), sucrose concentration (10–700 mM), and gallic acid concentration (30–619 mM)
