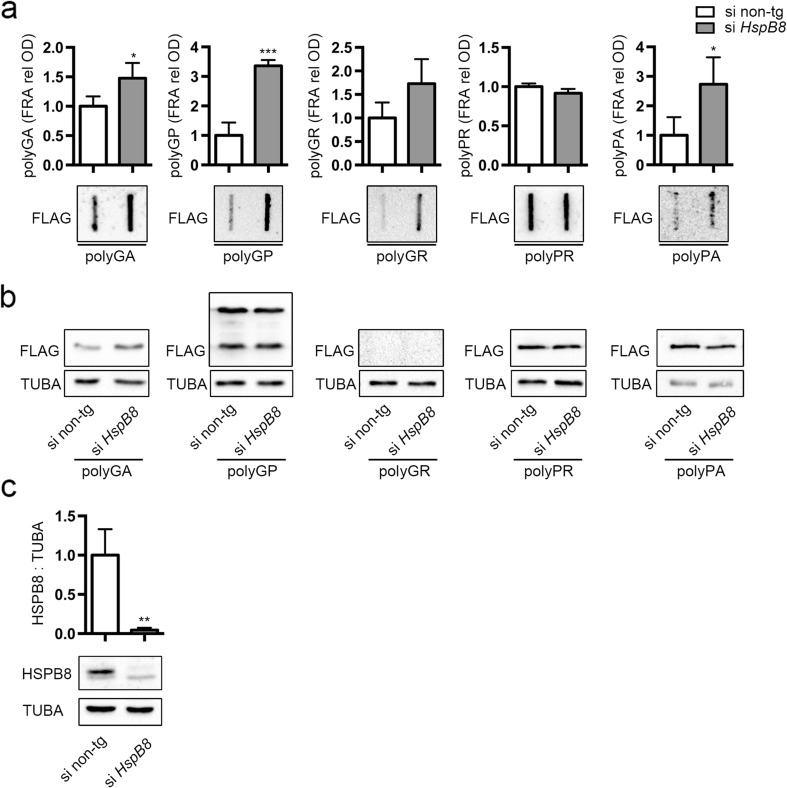
Fig. 5.
Effect of HSPB8 silencing on DPRs levels. NSC34 cells were transfected with non-target or HspB8 siRNA and FLAG-polyDPRs (GA, GP, GR, PR, PA). a FRA shows PBS insoluble fraction of DPRs. Bar graph represents the FRA mean relative optical density computed over three independent biological samples for each condition (n = 3) ± SD (* = p < 0.05, *** = p < 0.001; Student’s t test). b WB shows DPRs total levels; TUBA was used as loading control. c WB shows HSPB8 levels; TUBA was used as loading control. Bar graph represents the HSPB8/TUBA ratio computed over three independent biological samples for each condition (n = 3) ± SD (** = p < 0.01; Student’s t test)

