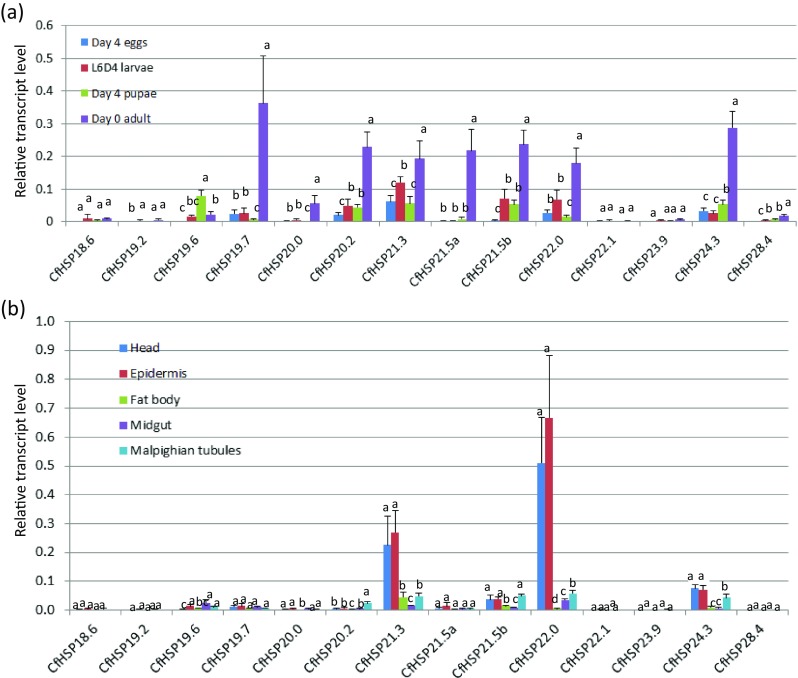
Fig. 4.

Developmental expression profiles of CfHSP transcripts. a Relative CfHSP transcript levels at different developmental stages. b Relative CfHSP transcript levels in different tissues of day 4 sixth-instar larvae. Values are means ± SD of three to four biological replicates, with two technical replicates each and are expressed as apparent expression levels relative to the control gene, translation elongation factor-1α (Tef-1α). For each gene, different letters above the bars indicate the significant differences compared with the other stages or tissues (P < 0.05)
