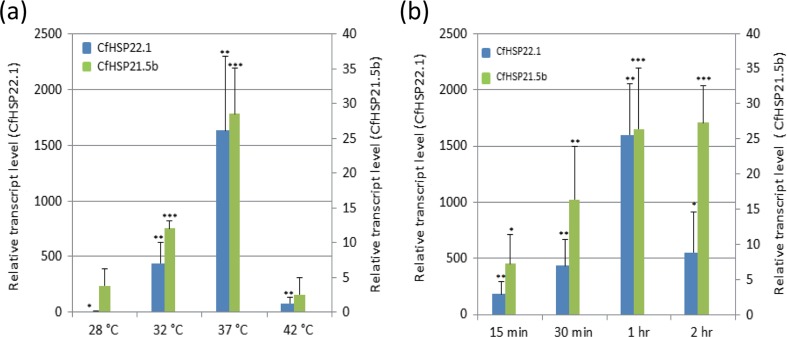
Fig. 5.
Effects of heat stress temperature and duration on CfHSP transcript levels. Day 4 sixth-instar larvae were treated at different temperatures for 1 h (a) or at 37 °C for different times (b). Expression levels are represented as relative expression units after normalization to the translation elongation factor-1α (Tef-1α). Values are means ± SD of three independent biological replicates. The expression levels of control samples were set as 1. The asterisks above the bars indicate the significant differences in expression levels by Student’s t test (*P < 0.05, **P < 0.01, and ***P < 0.001). The expression level of CfHSP22.1 at 28 °C was too low to be seen in a, but the statistical significance of the change in transcript level in response to heat stress is shown

