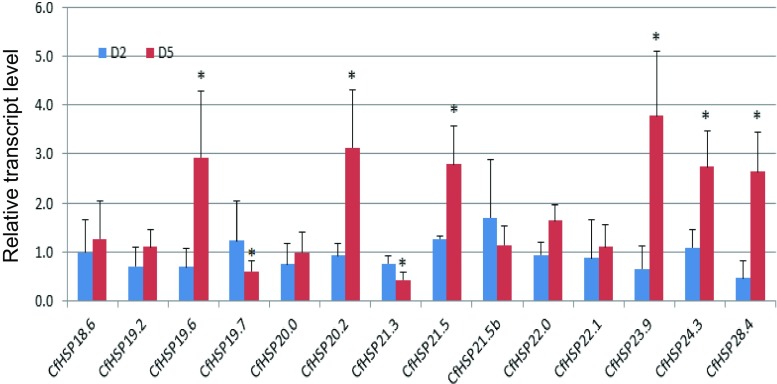
Fig. 7.
Relative transcript levels of CfHSPs in response to starvation. CfHSP transcripts in larvae starved for two days (D2) or five days (D5). Values are means ± SD of four biologically independent replicates. The expression levels of control samples were set to 1. Statistical significance within genes was determined using the Student’s t test (P < 0.05) and is labeled with an asterisk

