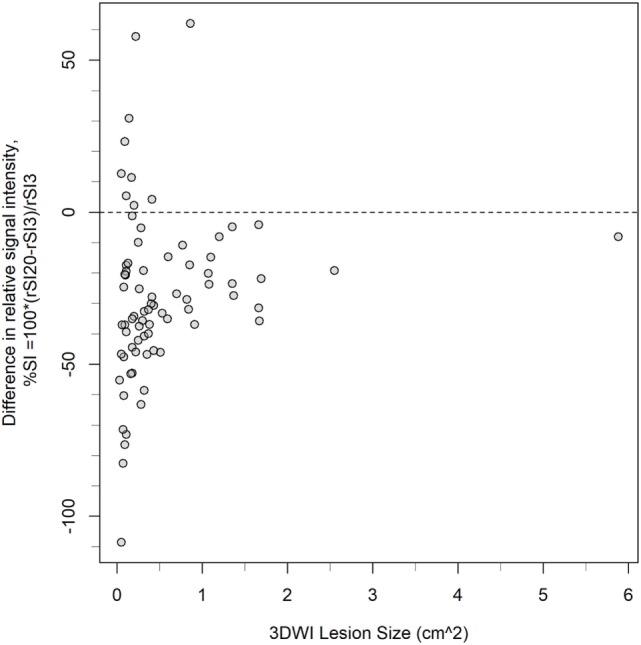
Figure 6.

Distribution of lesions according to size measured on 3-gradient direction DWI (3DWI), and the two sequences’ difference in relative signal intensity (%SI), N = 76. The dashed reference line indicates where rSI3 = rSI20. Small lesions show highest variation in the two sequences’ difference in relative signal intensity (%SI), and predominantly highest relative signal intensity on 3DWI (i.e., %SI is negative).
