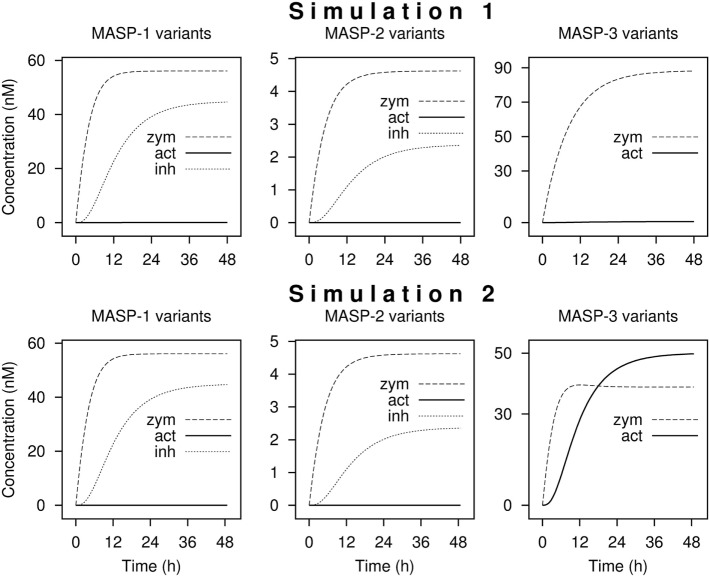
Figure 5.
Kinetic simulations of the activation of lectin pathway proteases. Time courses of the concentrations of zymogen (zym), active (act), and combined C1-inhibitor and antithrombin bound (inh) forms of MASP proteases from kinetic simulations are shown starting with zero levels of mannose-binding lectin (MBL)-associated serine protease (MASPs). Simulation 1 was performed with measured rate constants. For Simulation 2, the rate constant of the activation of MASP-3 by zymogen MASP-1 was increased by a factor of 200. The full set of kinetic parameters is found in Table S1 in Supplementary Material. The reaction set is depicted in Figure 6 within the boxed area. Steady-state distributions are shown in Table 3.

