
Figure 3.
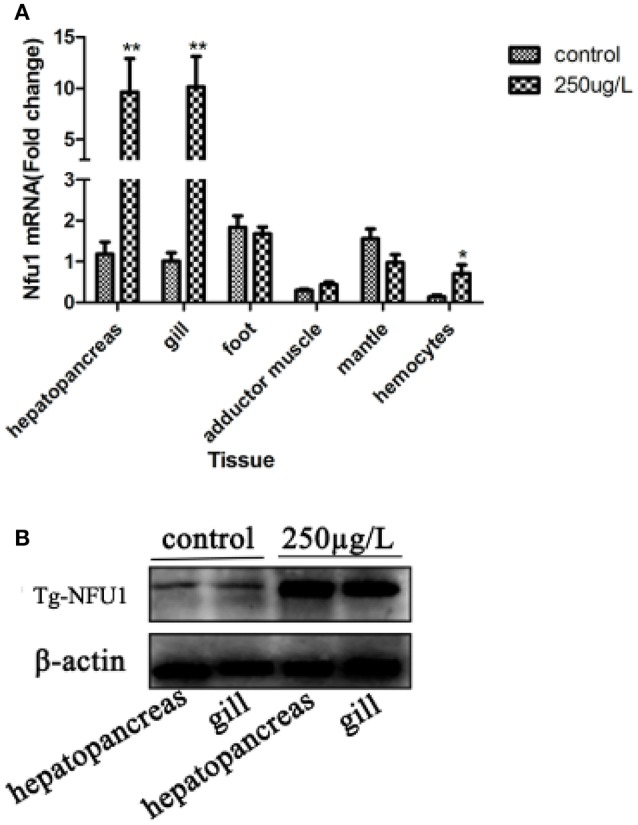
Tg-Nfu1 gene and Tg-NFU1 protein expression after 24 h of Cd stress. (A) Real-time analysis of the amount of Tg-Nfu1 transcript relative to 18rRNA transcript in various tissues. Expression levels were calibrated against gill (control). Vertical bars represent the means ± S.D., n = 3. Asterisks indicate significant differences: **p < 0.01; (B) Tg-NFU1 protein expression in hepatopancreas and gill. Control: treated with seawater for 24 h; 250:250 μg/L of Cd stress for 24 h.