Figure 2.
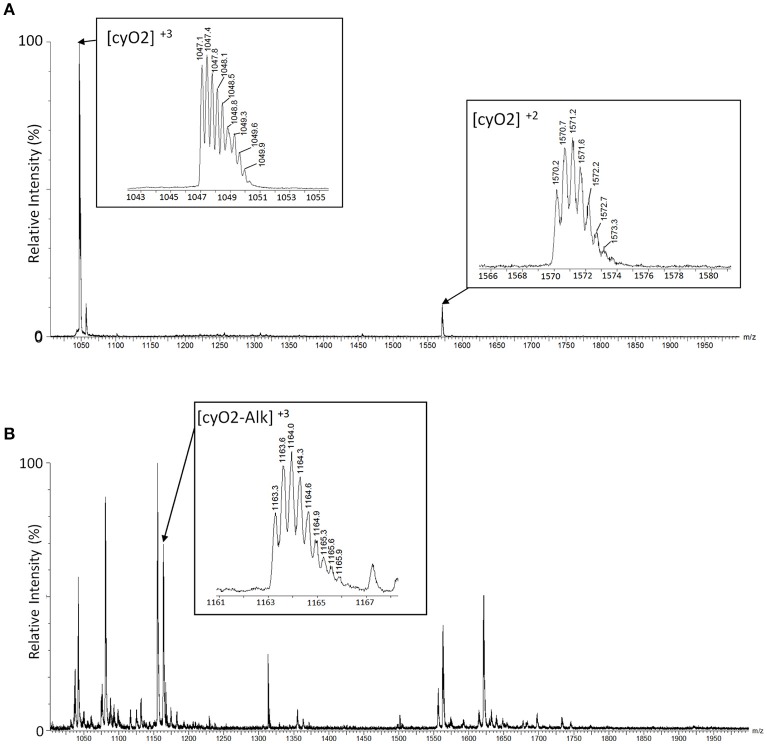
Identification of cyclotides by alkylated mass changes on LC-MS. Mass spectra of a cyclotide (cyO2) are shown with a comparison between the mass spectra of the plant extract before alkylation (A) and after alkylation (B). (A) We identified the mass spectra of the cyclotide-like using the mass distance on their isotopic peaks. The triple-charged monoisotopic mass of the cyO2 (marked as [cyO2]+3 in the box) is observed as 1047.1Da, and the double-charged monoisotopic mass ([cyO2]+2) is observed as 1570.2Da. In each mass spectrum, the distances between isotopic peaks are observed with ~0.3Da for [cyO2]+3, and 0.5Da for [cyO2]+2. The monoisotopic mass of the cyO2 is 3138.4Da (calculated) and 3138.3Da (observed), and the mass difference is 0.1Da. (B) The monoisotopic mass of the cyO2 after the alkylation reaction is 3486.6Da (calculated) and 3486.9Da (observed), and the mass difference is 0.3Da. The calculated mass is based on the triple-charged monoisotopic mass of cyO2 (1163.3Da), and its related mass spectrum is shown in the box marked [cyO2-Alk]+3.

