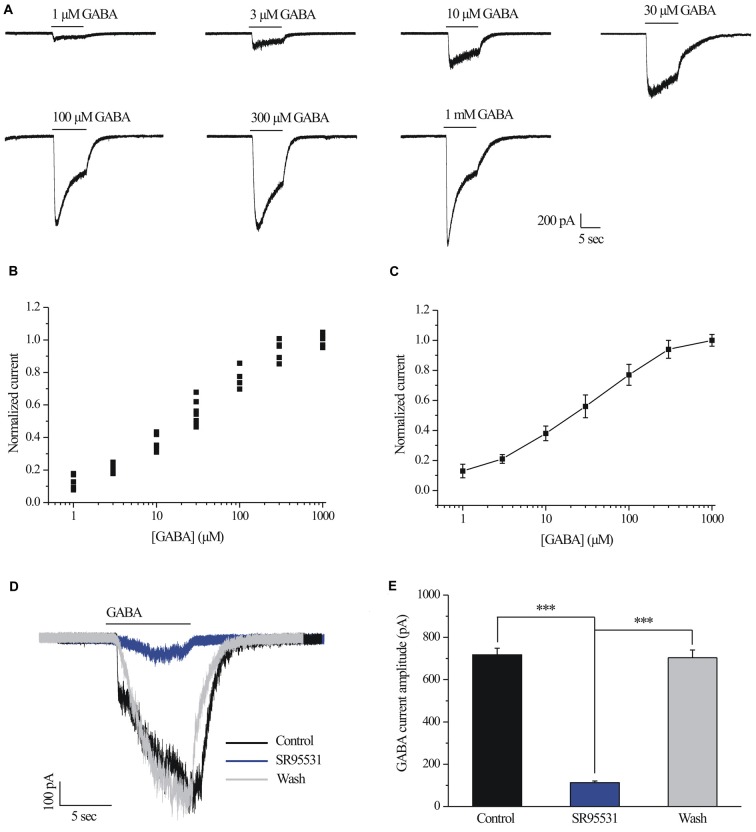
Figure 1.
γ-aminobutyric acid (GABA) dose-response relationship of retinal ganglion cells (RGCs). (A) The concentrations of GABA are indicated above the current traces. The bars delineate the beginning and duration of GABA application (8 s). Vertical calibration bar, 200 pA; horizontal calibration bar, 5 s. (B) Scatter plot showing the GABA concentration-response relationship of RGCs. The data were normalized to the maximal current obtained with 1 mM GABA. (C) The mean ± SE of the cells in (B) were plotted vs. the GABA concentration. The line represents the best fit of the data to a sigmoidal function. (D) Representative GABA-induced whole-cell currents in control, in the presence of 10 μM SR95531, and after washing out SR95531. Vertical calibration bar, 100 pA; horizontal calibration bar, 5 s. Control and washout responses without SR95531 were measured at the beginning and end of each experiment, respectively. (E) Summarized data of the amplitude of GABA-evoked currents (n = 11). ***p < 0.001 (one-way analysis of variance). Holding potential was −70 mV. The results are expressed as the mean ± standard error.

