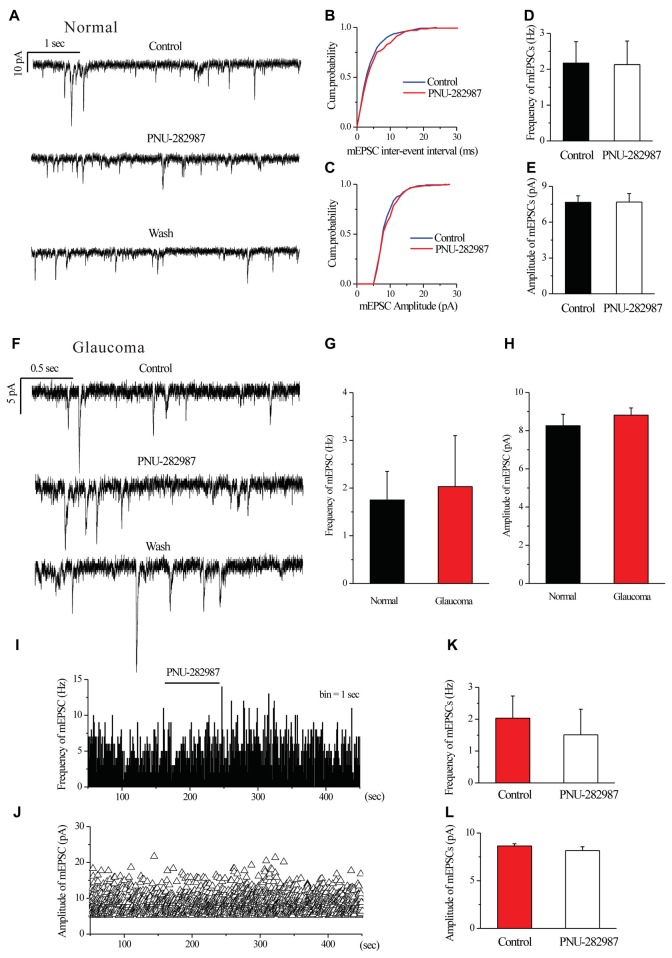
Figure 4.
Ocular hypertension or PNU-282987 did not cause a significant frequency or amplitude change in the miniature glutamatergic excitatory postsynaptic currents (mEPSCs) of RGCs. (A) Recording from a representative normal rat experiment during control conditions, during PNU-282987 application (10 μM) and during recovery. Vertical calibration bar, 10 pA; horizontal calibration bar, 1 s. (B,C) Cumulative probability plots of mEPSC inter-event interval (B) and amplitude (C) before and during application of PNU-282987 (n = 6, Kolmogorov–Smirnov test). (D,E) Summarized data of the frequency (D) and amplitude (E) of the mEPSCs in normal RGCs (n = 6). (F) Recording from a representative glaucomatous rat experiment during control conditions, during PNU-282987 application (10 μM) and during recovery. Vertical calibration bar, 5 pA; horizontal calibration bar, 0.5 s. (G,H) Bar graph illustrating the frequency (G) and peak amplitude (H) of the responses recorded from normal (n = 4 in frequency; n = 6 in amplitude) and glaucomatous (n = 5) RGCs. (I,J) Frequency (1-s bin) and amplitude histograms of the mEPSCs of the trace in (F). (K,L) Summarized data of the frequency (K) and amplitude (L) of the mEPSC in glaucomatous RGCs (n = 6). The results in (D,E,G,H,K,L) are expressed as the mean ± standard error.

