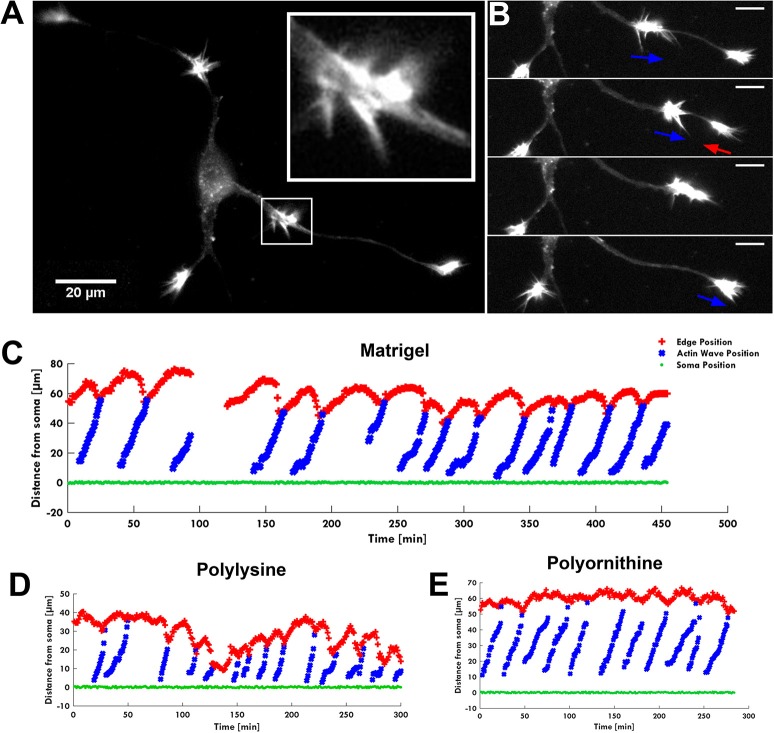
Figure 1.
The AW pulling effect on GC. (A) Fluorescence image of F-actin showing an actin wave advancing along a neurite with its characteristic growth cone-like shape (white square). The insert shows a higher magnification of the growth cone-like AW. (B) Time-lapse images of the neurite shown in (A). When an AW approaches the distal neurite, the GC retracts several microns to reach the wave, then merges with it and advances following the wave arrival. Blue arrows indicate AW direction; red arrows indicate GC retraction. Scale bar refers to (A,B) = 20 μm. (C–E) Plots showing the progression of several AWs (blue) shown in (A,B) and Supplementary Video 1 from the soma (green) along the neurite. The origin of the axes is set to the initial soma position. The edge of the neurite (red) shows the retraction/growth cycles of the GC upon arrival of the AW. The mean velocity of AWs is 2.2 ± 0.4 μm/min. For these experiments, the hippocampal neurons were plated on different substrates: Matrigel/Laminin (C), poly-D-lysine (D) and poly-L-ornithine (E).

