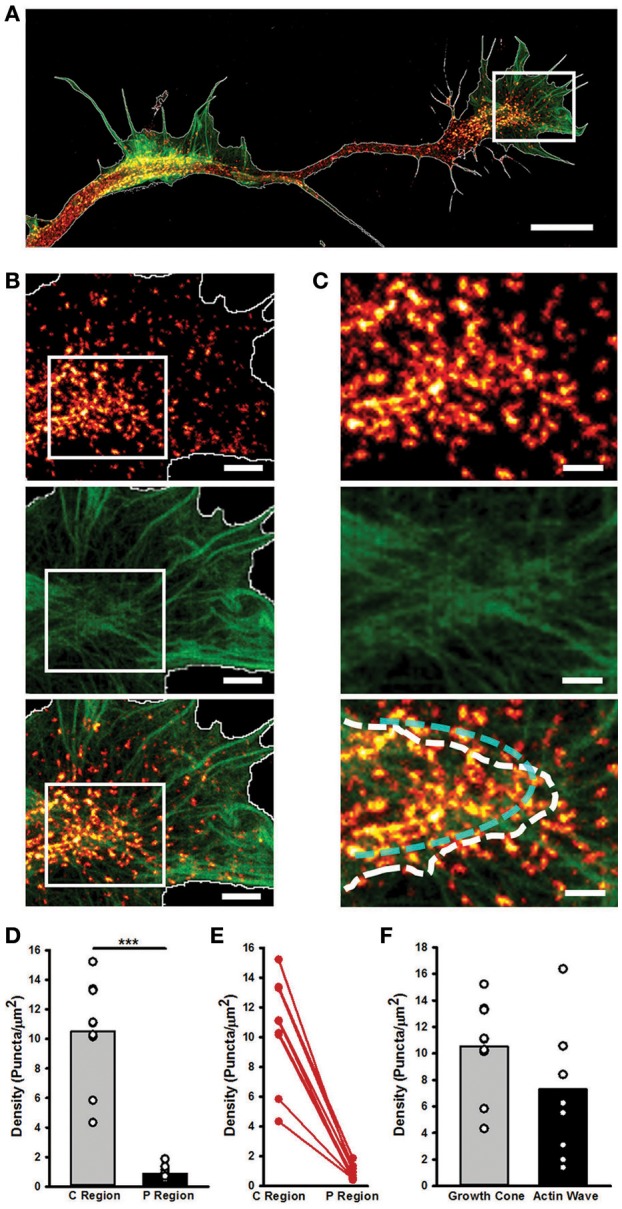
Figure 6.

STED microscopy highlights GC and AW similarities and differences in myosin IIB localization. (A) Merged Image showing the Myosin IIB and actin channels of the neurite in Figure 4. The edge is highlighted in white. Scale bar = 5 μm. (B) Magnifications of the region delimited by the white box in (A) showing the actin (top panel), Myosin IIB (middle panel) and both (bottom panel) channels. Scale bar = 1 μm. (C) Magnifications of the area delimited by the white boxes in (B) of the border between the central and peripheral regions of the GC. The white dashed line defines the border between the central and peripheral regions of the GC, while the cyan dashed line highlights the acto-myosin contractile arcs of the transition zone. Scale bar = 500 nm. (D) Histogram showing that the density of the Myosin IIB puncta is significantly higher in the central and transition zones than in the peripheral region. (n = 9 GCs). (E) Plot showing the constant decrease (depicted in red) in the density of Myosin IIB puncta between the Central and Peripheral regions of the GC. (F) Histogram showing the density of Myosin IIB puncta in the GC with respect to the correspondent AWs. (n = 9 neurites). Student's test was performed for histograms: ***P < 0.001.
