Figure 8.
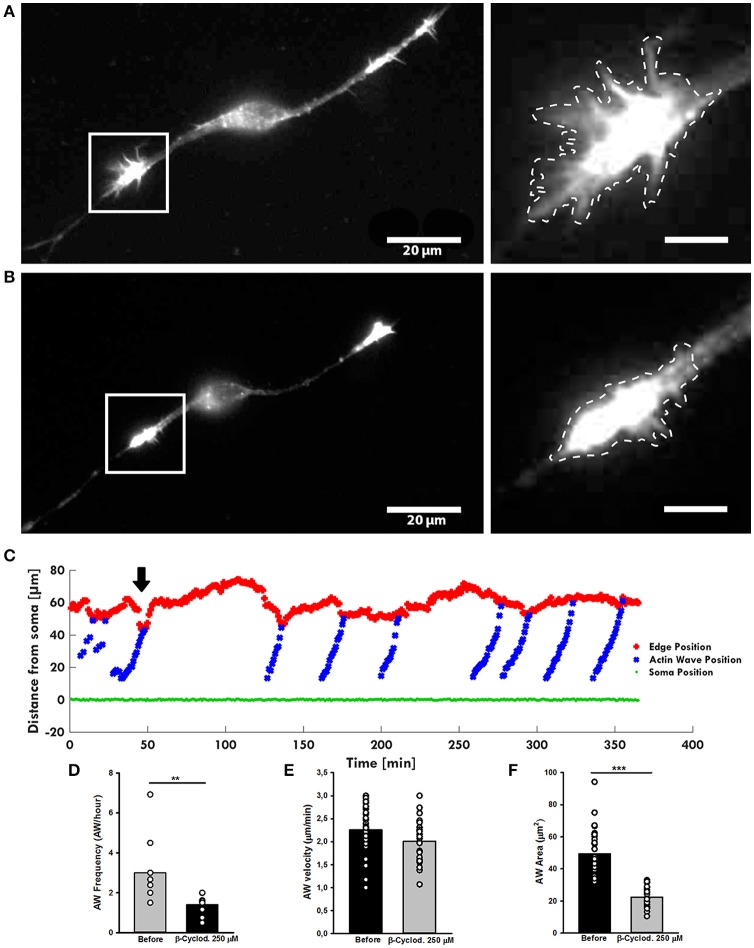
β-cyclodextrin treatment affects AWs structure. (A,B) Live-cell images of an AW before (A) and after (B) β-cyclodextrin treatment (250 μM). On the right, magnified views of the AWs showed in (A,B) before and after β-cyclodextrin treatment that abolishes completely the growth cone-like shape. Images were collected every 10 s. Dashed lines indicate the AW's shape before (A) and after (B) the β-cyclodextrin treatment. Scale bar in (A) = 20 μm. Scale bar in (B) = 5 μm (C). Plot highlighting the progression of the AWs (blue) showed in (A,B) from the soma (green) along the neurite. The origin of the axes is set at the initial soma position. The black arrowhead indicates β-cyclodextrin addition: cholesterol depletion decreases the neurite retraction. The edge trace (red) highlights the slight reduction of the GC retraction upon AW arrival after β-cyclodextrin treatment (D) Quantification of the AWs frequency calculated on neurons before and after β-cyclodextrin treatment for 4 h and imaged as in (A,B). N = 9 neurites. (E) Quantification of the AWs velocity (μm/min) calculated on neurons treated with or without β-cyclodextrin for 4 h and imaged as in (A,B). N = 16 AWs. (F) Quantification of the AWs mean area (μm2) calculated on neurons treated with or without β-cyclodextrin for 4 h and imaged as in (A,B). N = 16 AWs. Student's and U-Man Whitney tests were performed for histograms: **P < 0.01; ***P < 0.001.

