Fig. 1.
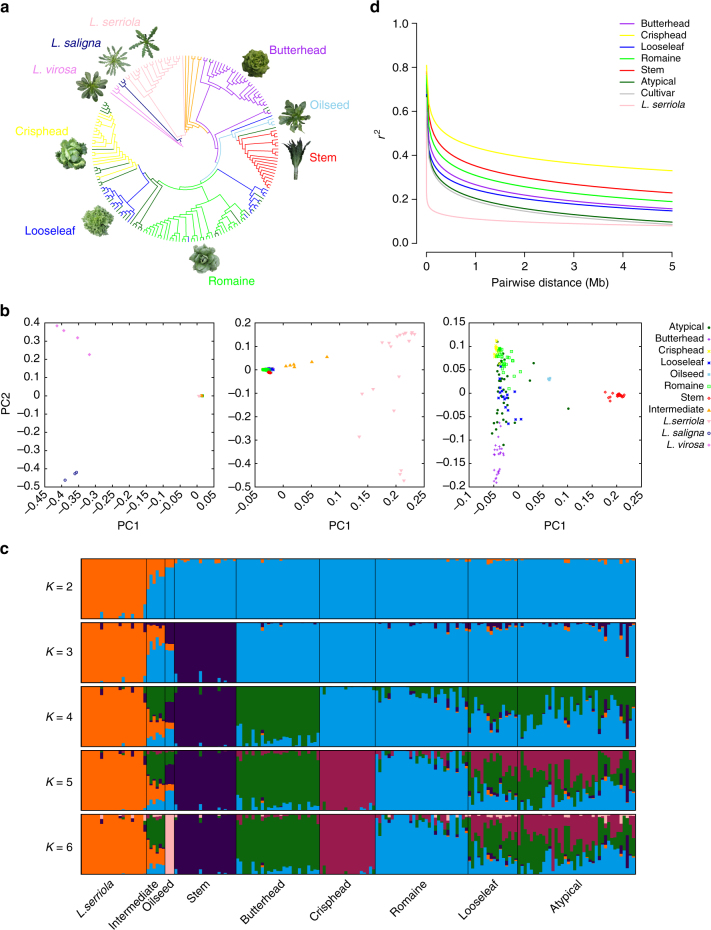
Population genetic analyses of wild and cultivated lettuce. a Maximum-likelihood phylogenetic tree constructed using 503,369 SNPs. Colors indicate the following groups: violet, L. virosa; navy blue, L. saligna; pink, L. serriola; orange, intermediate group; dark green, atypical group; sky blue, oilseed; red, stem; green, romaine; blue, looseleaf; yellow, crisphead; purple, butterhead. b PCA of Lactuca accessions. The first two principal components were used to visualize the relationship among individuals and groups. Each point represents an independent accession of Lactuca. From left to right are: the results of PCA analysis on all Lactuca accessions; the results of PCA analysis with the exclusion of L. virosa and L. saligna; the results of PCA analysis with the exclusion of the intermediate type, L. serriola, L. virosa and L. saligna. c Population structure analysis with different numbers of clusters (K = 2–6). The y axis quantifies cluster membership and the x axis shows the different populations. d LD decay of L. sativa and L. serriola measured by r 2

