Fig. 4.
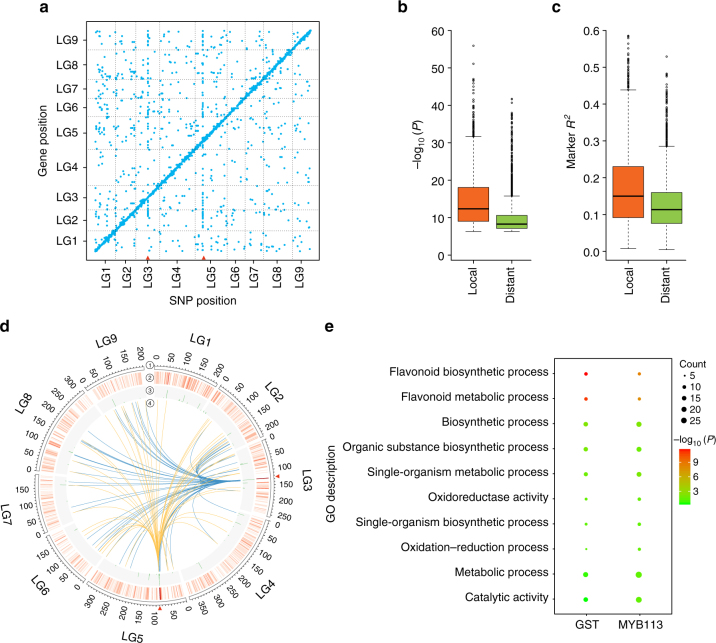
Genome-wide mapping of eQTL. a eQTLs identified using GWAS. The middle position of each detected eQTL is plotted against the middle position of the mapped gene. The x-axis indicates the positions of the eQTLs and the y-axis indicates the positions of the mapped genes. Each dot represents a detected eQTL. Two red triangles indicate the two most significant distant eQTL hotspots, each of which are eQTLs of dozens of genes. b Boxplots of the −log10(P) values of local and distant eQTLs. The median value of −log10(P) is 12.37 and 8.28 for local and distant eQTLs, respectively. c Boxplots of the effects of local and distant eQTLs. The median value of effect is 14.99% and 11.34% for local and distant eQTLs, respectively. d Visualization of distant eQTL hotspots using Circos69. Two red triangles on chromosomes 3 and 5 indicate the two most significant distant eQTLs. 1 Nine chromosomes of lettuce. 2 Heatmap that showing the counts of targets in a 2 Mb window across the genome. 3 Histogram that showing the significance (calculated by −log10(P value)) of each distant hotspot. 4 Links between the two most significant distant eQTL hotspots and their target regions. e GO enrichment analysis of target genes of GST and MYB113, respectively

