Fig. 5.
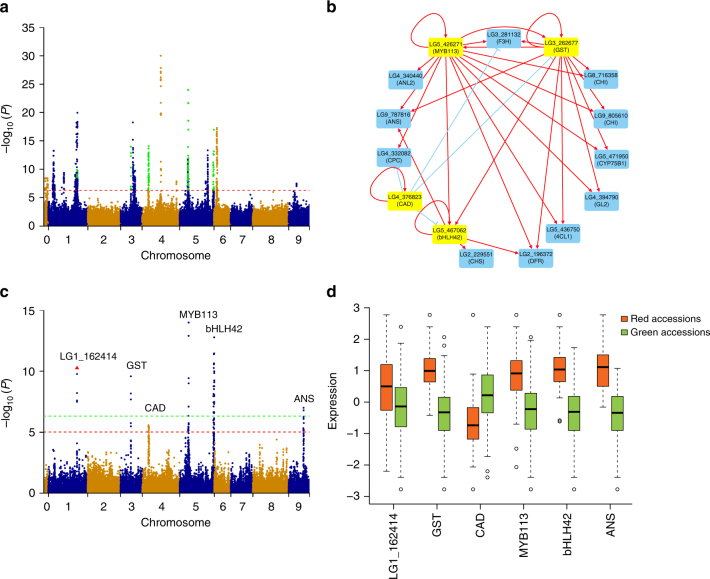
Regulatory network of genes associated with flavonoid biosynthesis. a Combined Manhattan plots from the eQTLs of 24 genes associated with flavonoid biosynthesis. Green dots represent the significantly associated loci that were coincident with regions identified using the GWAS for the leaf anthocyanins. Chromosome 0 represents unanchored scaffolds. The red horizontal dashed line corresponds to the Bonferroni-corrected significance threshold (−log10(P) = 6.31, α = 0.05). b The inferred regulatory network for flavonoid biosynthesis using the iGA approach. Each node is a gene, and each edge is a predicted regulatory connection between genes. Yellow nodes represent candidate regulatory genes, and blue nodes represent the target genes. Red arrows indicate positive regulation, while blue bars indicate negative regulation. Cytoscape70 was used to display the network. c Manhattan plot for leaf color. Six candidate genes are shown along the top of the significant associated signals. The red and green horizontal dashed lines correspond to the suggestive (−log10(P) = 5.02, α = 0.1) and significant (−log10(P) = 6.32, α = 0.05) threshold, respectively. The red triangle indicates the proposed functional site (1_125530709) in gene LG1_162414. d The identified six candidate genes were significantly (P ≤ 7.8 × 10⁻⁴ for all six candidates) differentially expressed between red and green accessions. The expression values of each gene were normal quantile transformed

