Fig. 4.
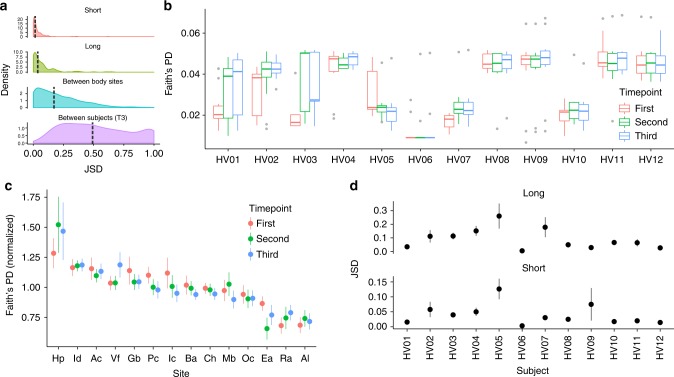
Diversity and richness of P. acnes in the human skin data set. a Short: for each subject/site pair, we computed the distribution of the JSD between the second and the third time point. Long: the same distribution computed between the first and the second time point. Between body sites: the JSD distribution computed between body sites for each subject/time point pair. Between subjects (T3): for each site, the distribution was computed between subjects at the third time point. Vertical dashed lines represent the median values. b Using the predictions of StrainEst, we could give an estimate of the diversity of the subject-specific P. acnes populations using Faith’s phylogenetic diversity (PD) index. Two different phenotypes could be identified, with high (HV04, HV08, HV09, HV11, and HV12) and low (HV07 and HV10) PD. Three individuals (HV01, HV02, and HV03) switched between low and high phenotype during the course of the study, while one (HV05) switched from high to low PD. Boxes extend to the first and third quartile, whiskers extend to the upper and lower value within 1.5*IQR from the box. Outliers are shown as points. c Faith’s PD computed for each site and normalized per subject highlights more diverse (such as Hp) and less diverse environments (Ea, Ra, and Al). d Long: JSD between samples from each individual between the first and second timepoints. Short: the same, between the second and the third timepoints. This individual-specific temporal variability analysis of the P. acnes population shows that subjects (e.g., HV01) that are stable in the first interval tend to maintain these characteristics also in the second, while individuals that are characterized by high variability (e.g., HV05) in the first interval are highly variable also in the following time frame. For c and d, points indicate the mean values, error bars the standard errors

