Fig. 6.
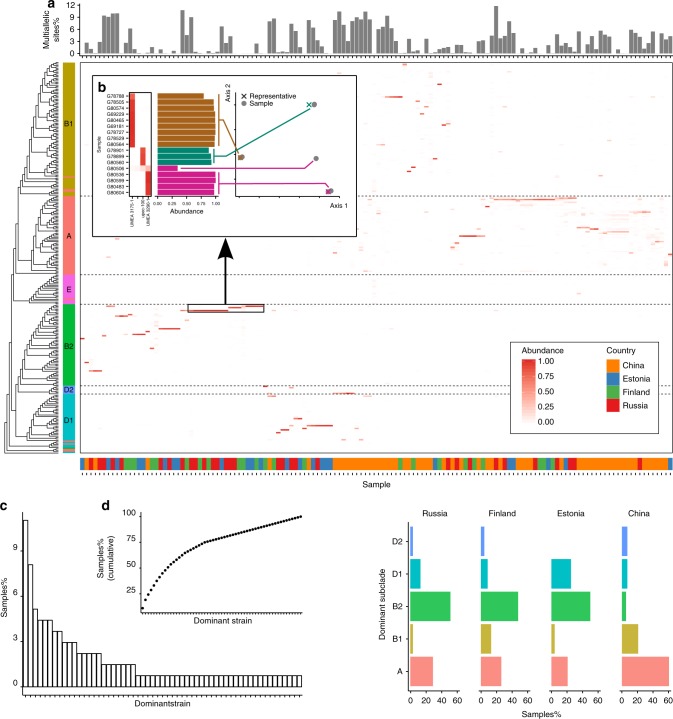
E. coli meta-analysis. a Distribution of E. coli strains in two large studies including fecal samples from 222 infants from Estonia, Finland, and Russia, and 345 adults from China. Samples with a reconstruction Pearson R < 0.9 and a minimum depth of coverage < 10 were discarded obtaining a total of 136 individuals. The upper panel reports the percentage of sites where the dominant allelic variant is supported by less than 90% of the aligning reads, suggesting the presence of more than one strain. The origin of the sample is shown by the lower bar. Samples are ordered by an average linkage hierarchical clustering using weighted UniFrac distance. b Consensus SNV profile from samples dominated by four closely related strains is clearly distinct and closely related to the reference strain identified by StrainEst. In one case (sample G80506), StrainEst fails to identify the dominant strain, probably due to the lack of a closely related reference in the sequence database. Considering only the dominant component, only 23 strains were sufficient to cover 75% of the samples (c, d). Despite the presence of several ubiquitous strains, clustering of the samples according to their origin was evident. This clustering was related to the prevalence of the different phylogroups, shown in e. While the dominant strain was in 60.3% of the cases from phylogroup A in the Chinese panel, this percentage was 20.8%, 26.1%, and 29.3% in Estonian, Finnish, and Russian infants, respectively. In the latter samples, the most frequent dominant strain was in all cases from phylogroup B2 (50.0%, 47.8%, and 51.6%)

